Note
Click here to download the full example code
Fine-tuning Skeletons#
Fine-tune skeleton plots: colors, line width, radii and more.
By now, you should already have a basic understanding on how to plot neurons in NAVis (2d vs 3d plots, the various backends and plotting methods, etc.) - if not, check out the plotting tutorial.
We will focus on how to finetune plot2d plots because matplotlib is much more flexible than the plot3d backends when it comes to rendering lines. That said: some of the things we show here will also work for the other backends (Octarine and K3d) - just not all.
Here are the three main parameters for styling skeleton lines at a glance:
| Parameter | Effect | Works in plot3d? |
|---|---|---|
radius | Draw skeletons as tubes (True) or as lines (False, default) | |
linewidth | Line thickness - also scales the tubes when radius=True; default 1 | |
linestyle | Dash style, e.g. "--" (only when radius=False); default "-" |
Radii#
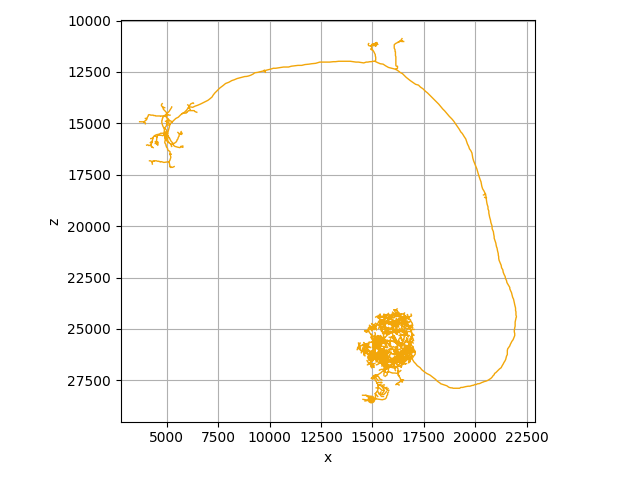
If your skeletons have radii (i.e. there is a non-empty radius column in their .nodes SWC table), you can plot them as tubes instead of lines using the radius parameter. By default, radius is set to False and skeletons are plotted as lines1.
The default - fast and good for many skeletons at once:
navis.plot2d(n, view=("x", "-z"), method="2d")
Uses each node's radius to draw tubes:
navis.plot2d(n, view=("x", "-z"), method="2d", radius=True)
import navis
import matplotlib.pyplot as plt

# Load a neuron
n = navis.example_neurons(1, kind="skeleton")

# Render the tube version:
fig, ax = navis.plot2d(n, view=("x", "-z"), method="2d", radius=True)
plt.tight_layout()
Line width#
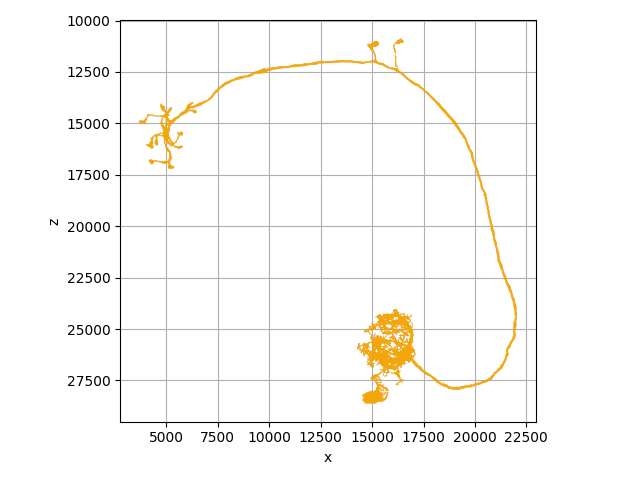
You can change the line width of the skeletons using the linewidth parameter. The default is 1.
fig, ax = navis.plot2d(
    n,
    view=("x", "-z"),
    method="2d",
    radius=False,
    linewidth=2,  # default linewidth is 1
)
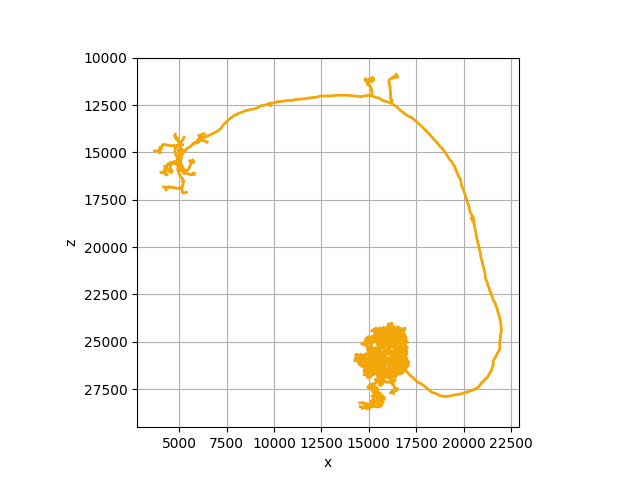
linewidth can also be used to scale the size of the tubes when radius=True:
fig, ax = navis.plot2d(
    n,
    view=("x", "-z"),
    method="2d",
    radius=True,
    linewidth=2,  # double the tube radii
)
Line style#
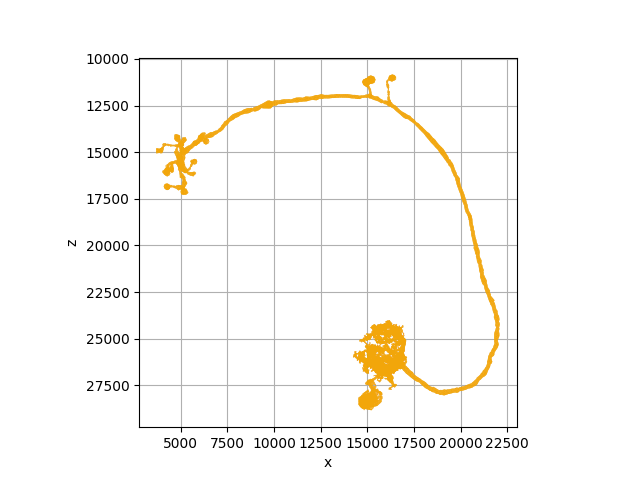
When radius=False, you can change the line style of the skeletons using the linestyle parameter. The default is "-" (i.e. a solid line).
fig, ax = navis.plot2d(
    n,
    view=("x", "-z"),
    method="2d",
    radius=False,
    linewidth=2,
    linestyle="--"  # dashed line
)
linestyle is matplotlib-only
The radius and linewidth parameters also work with plot3d, but linestyle does not - it is specific to the matplotlib (plot2d) backend.
Total running time of the script: ( 0 minutes 1.956 seconds)
Download Python source code: tutorial_plotting_04_skeletons.py
Download Jupyter notebook: tutorial_plotting_04_skeletons.ipynb
Gallery generated by mkdocs-gallery
-
This is because plotting tubes can be slow for large number of skeletons. ↩