Note
Click here to download the full example code
Coloring#
This tutorial demonstrates how to adjust colors in NAVis plots.
By now, you should already have a basic understanding on how to plot neurons in NAVis (2d vs 3d plots, the various backends and plotting methods, etc.) - if not, check out the plotting tutorial.
In this tutorial we will focus on how to finetune these plots by changing colors  . We will demonstrate this using
 matplotlib (plot2d) and plotly (plot3d) but everything shown here also works for the other backends (Octarine, Vispy and K3d)!
Neuron Colors#
Undoubtedly one of the most important aspects of a plot is the color scheme. In NAVis you can control the color of individual neurons, their compartments, synapses, etc. in a variety of ways. Here are a few examples that should get you started:
import navis
import matplotlib.pyplot as plt

nl = navis.example_neurons(3, kind="mesh")
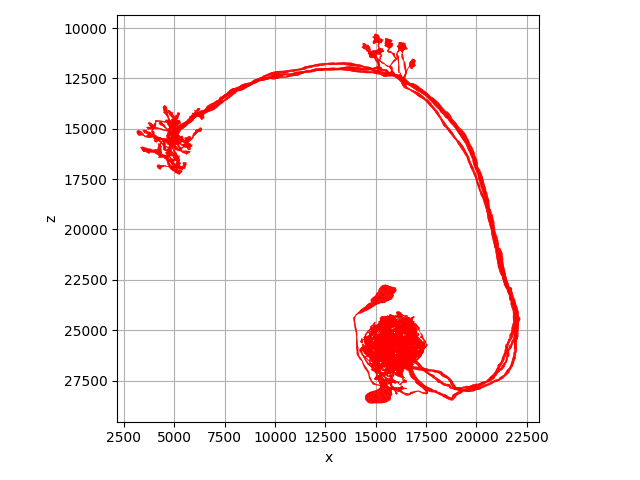
A single color for all neurons:
navis.plot2d(nl, color="r", view=("x", "-z"), method="2d")
plt.tight_layout()
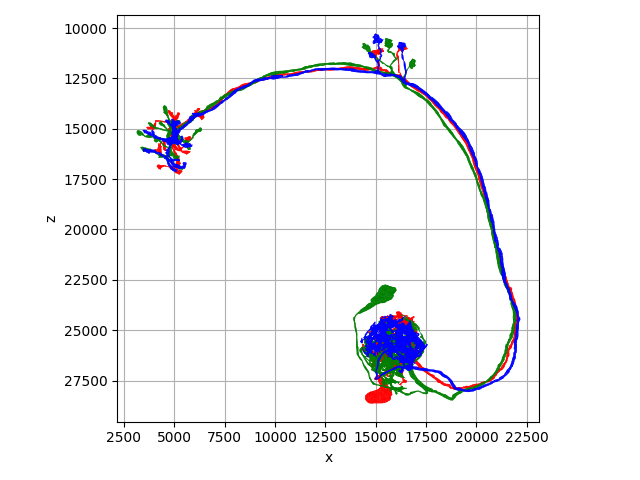
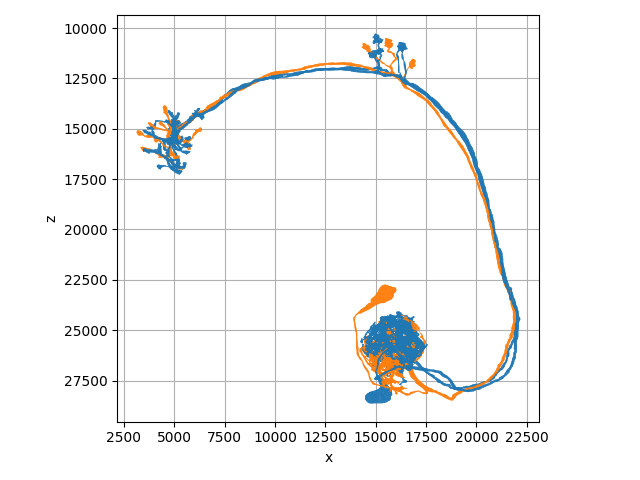
A list of colors for each neuron:
navis.plot2d(nl, color=["r", "g", "b"], view=("x", "-z"), method="2d")
plt.tight_layout()
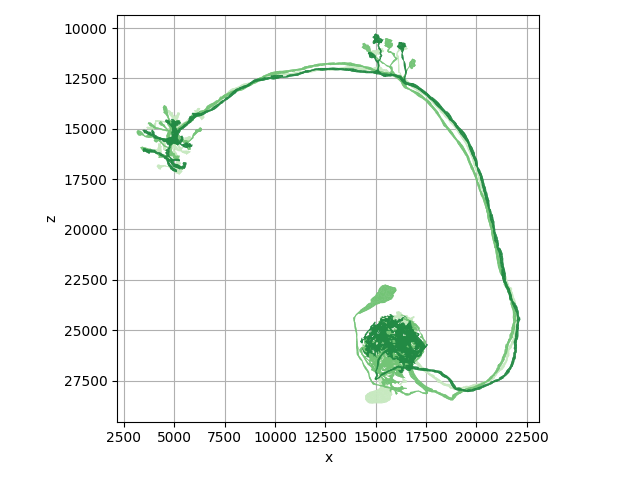
A palette to choose colors from:
navis.plot2d(nl, palette="Greens", view=("x", "-z"), method="2d")
plt.tight_layout()
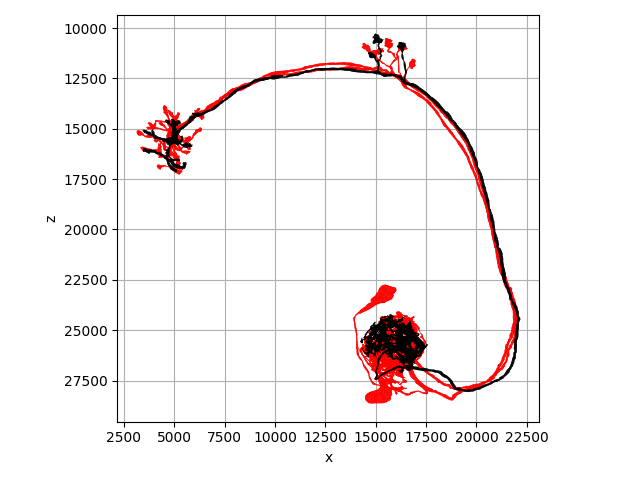
A mapping of neuron ID -> color:
colors = dict(zip(nl.id, ["r", "g", "b"]))
navis.plot2d(nl, color=colors, view=("x", "-z"), method="2d")
plt.tight_layout()

Individual colors can be provided as:
- names (e.g. "red", "green", "blue") like we did above
- hex codes (e.g. "#FF0000", "#00FF00", "#0000FF")
- RGB or RGBA tuples (e.g.
(1, 0, 0)for red)
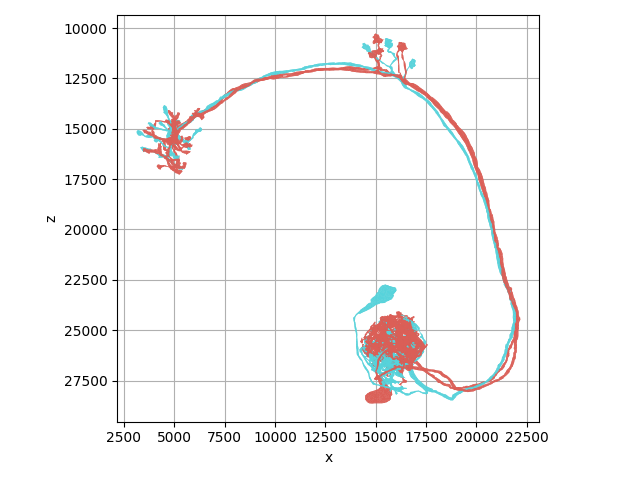
# Provide a list of 3 colors - one for each neuron - in various formats:
navis.plot2d(nl, color=["red", "#FF0000", (0, 0, 0)], view=("x", "-z"), method="2d")
plt.tight_layout()
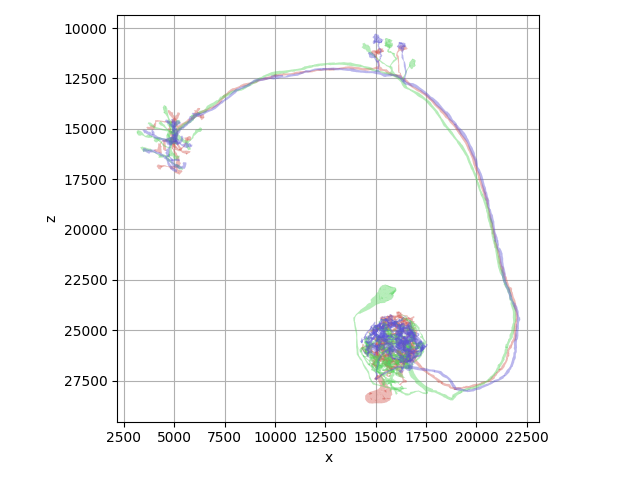
What if you want to color neurons by some categorical property - for example their type or brain region? Easy peasy: just use the color_by parameter!
# A list with labels, one for each neuron
types = ["typeA", "typeB", "typeA"]

navis.plot2d(nl, color_by=types, palette="tab10", view=("x", "-z"), method="2d")
plt.tight_layout()
NAVis automatically assigns a color to each unique label using the provided palette. You can also provide a dictionary to manually set the colors:
palette = {"typeA": "red", "typeB": "blue"}

navis.plot2d(nl, color_by=types, palette=palette, view=("x", "-z"), method="2d")
plt.tight_layout()
Coloring Neurites#
So far so good but what if you want to color the neurites of an individual neuron? For example make its axon red and its dendrites blue? Also easy peasy: color_by can also be used to color nodes/vertices!
By Labels#
n = navis.example_neurons(1, kind="skeleton")

# This will add a "compartment" for each node in the neuron
navis.split_axon_dendrite(n, label_only=True)

n.nodes.head()
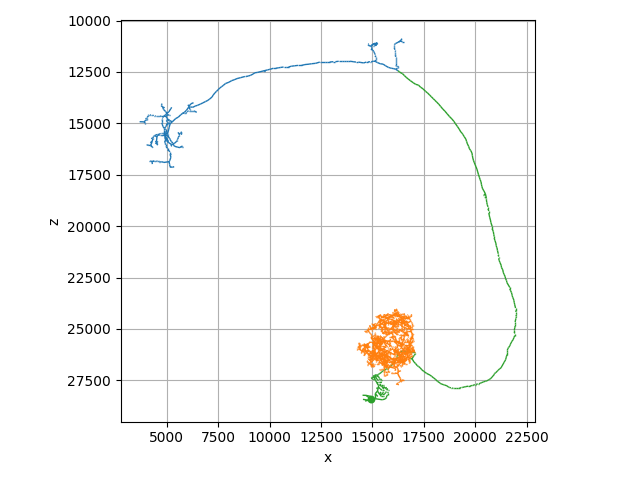
Now we can color the neuron based on the "compartment" label:
navis.plot2d(n, color_by="compartment", palette="tab10", view=("x", "-z"), method="2d")
plt.tight_layout()
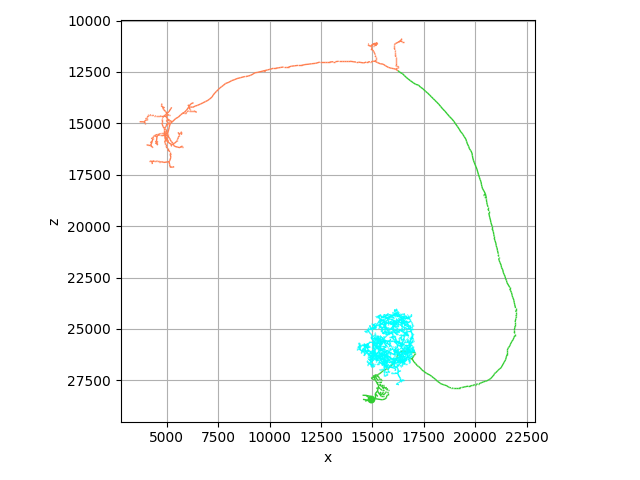
We can also set the colors manually:
colors = {"axon": "coral", "dendrite": "cyan", "linker": "limegreen"}
navis.plot2d(n, color_by="compartment", palette=colors, view=("x", "-z"), method="2d")
plt.tight_layout()
By Values#
You can also color neurites based on some numerical value. This is especially useful for things like Strahler index, branch order, etc.
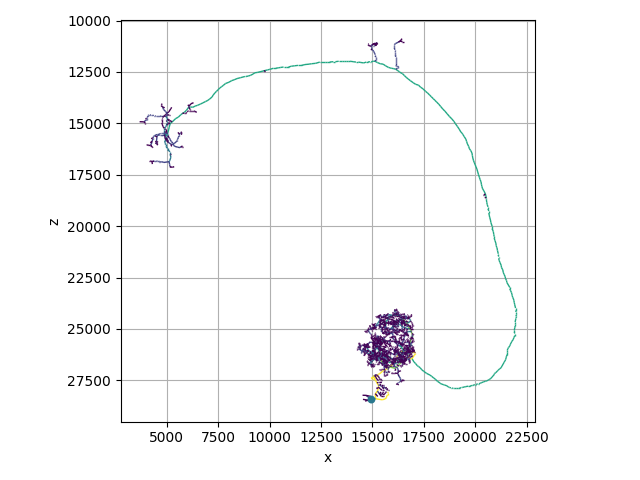
Coloring by e.g. Strahler index:
n = navis.example_neurons(1, kind="skeleton")

# This adds an `strahler_index` column to the node table
navis.strahler_index(n)

n.nodes.head()
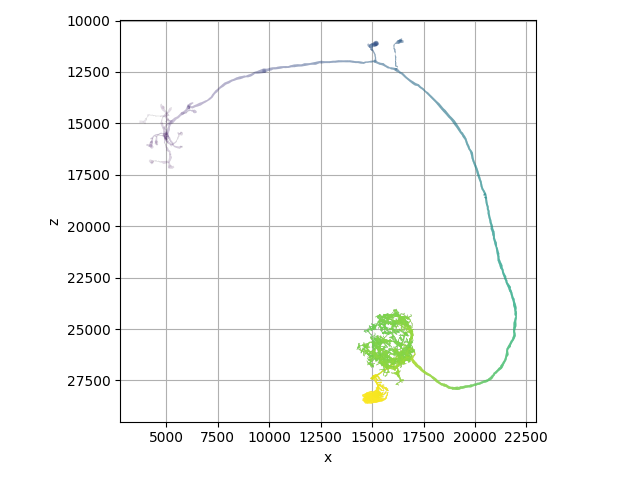
Plot with color based on Strahler index:
navis.plot2d(
    n, color_by="strahler_index", palette="viridis", view=("x", "-z"), method="2d"
)
plt.tight_layout()
Note
You can use the vmin and vmax parameters to control the normalization of the color scale.
All of this also works with MeshNeurons. Here, we have to provide a label for each vertex in the mesh:
m = navis.example_neurons(1, kind="mesh")
navis.strahler_index(m)
m.strahler_index  # this is an array with one value per vertex
Out:
/opt/hostedtoolcache/Python/3.10.17/x64/lib/python3.10/site-packages/skeletor/skeletonize/wave.py:198: DeprecationWarning:

Graph.clusters() is deprecated; use Graph.connected_components() instead

/opt/hostedtoolcache/Python/3.10.17/x64/lib/python3.10/site-packages/skeletor/skeletonize/wave.py:228: DeprecationWarning:

Graph.shortest_paths() is deprecated; use Graph.distances() instead


array([2, 3, 3, ..., 1, 4, 4], shape=(6309,))
# Let's use plot3d this time
navis.plot3d(m, color_by="strahler_index", palette="viridis", legend=False)
Note
In the examples above we have provided color_by as the name of a property or a column in the node table. We could have also provided an array of values directly:
navis.plot2d(n, color_by=n.nodes.strahler_index, palette="viridis")
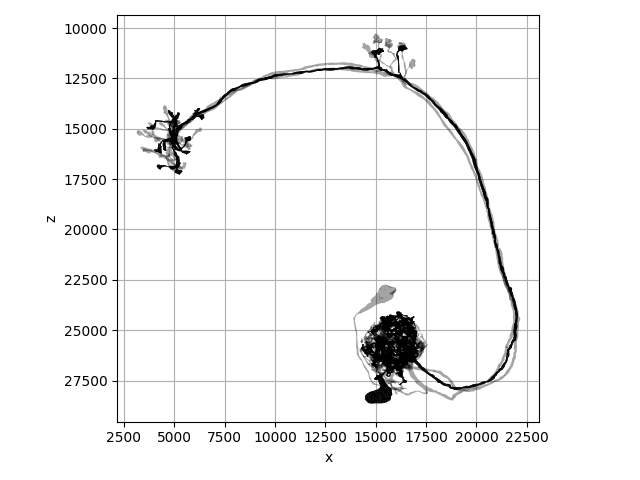
Neuron Opacity#
You can also control the opacity of the neurons. This is especially useful when plotting multiple neurons on top of each other:
# A single opacity for all neurons
navis.plot2d(nl, alpha=0.25, view=("x", "-z"), method='2d')
plt.tight_layout()
# A list of alpha values, one for each neuron
navis.plot2d(nl, color="k", alpha=[1, 0.2, 0.2], view=("x", "-z"), method='2d')
plt.tight_layout()
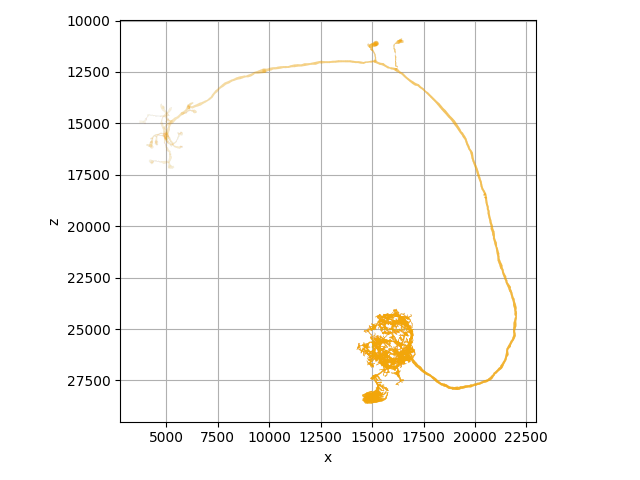
Shading#
Analogous to the color_by parameter, you can also shade neurons based on some property. Let's demonstrate this by shading a neuron based on its distance from the soma:
n = navis.example_neurons(1, kind="skeleton")
n.reroot(n.soma, inplace=True)
n.nodes["root_dist"] = n.nodes.node_id.map(navis.dist_to_root(n, weight="weight")) * -1
n.nodes.head()
# Plot with shading based on distance from the soma:
navis.plot2d(n, shade_by="root_dist", view=("x", "-z"), radius=True, method="2d")
plt.tight_layout()
We can combine color_by and shade_by to color and shade the neuron at the same time:
navis.plot2d(
    n,
    color_by="root_dist",
    shade_by="root_dist",
    palette="viridis",
    view=("x", "-z"),
    method="2d",
    radius=True
)
plt.tight_layout()
Total running time of the script: ( 0 minutes 11.948 seconds)
Download Python source code: tutorial_plotting_01_colors.py
Download Jupyter notebook: tutorial_plotting_01_colors.ipynb