Note
Click here to download the full example code
Neuron Collages#
Arrange hundreds of neurons on a single page.
This example is not executed
Like the light-level skeletonization tutorial, this one is not run when the documentation is built - it pulls 200 skeletons from a live neuPrint server, which is slow and needs a token. The code is real and runnable; the outputs and figures shown here are statically embedded.
Sooner or later you will want to put a lot of neurons on one page: a plate showing every cell type in a region, a poster, a supplementary "here is the whole dataset" figure. Doing that by hand - one subplot per neuron, then fiddling with the limits until the sizes look right - is tedious, and a regular grid spends most of the paper on the empty space around each arbor.
navis.plot_collage does the arranging for you: it scales and moves copies of your neurons onto a page and plots them. The originals are left untouched.
graph LR
    A[NeuronList] --> B{layout};
    B -->|"grid"| C[one neuron<br>per cell];
    B -->|"dense"| D[packed by<br>bounding box];
D -->|"occupancy=True"| E[packed by<br>the arbors themselves];| Layout | What it does | Reach for it when |
|---|---|---|
"grid" | one neuron per cell of a regular grid | you want to read individual neurons - a catalogue |
"dense" | packs them as tightly as they will go, keeping their relative sizes | you want the page full - a plate or a poster |
The neurons#
We will use the central complex of the male CNS dataset on neuPrint. See the neuPrint tutorial for how to set up the client and where to get a token.
import navis
import navis.interfaces.neuprint as neu

client = neu.Client("https://neuprint.janelia.org", "male-cns:v1.0")

# Metadata for every CX neuron
meta = neu.fetch_neurons(neu.NeuronCriteria(class_="CX"), omit_rois=True)

# One neuron per cell type, 200 of them
nl = neu.fetch_skeletons(
    meta.drop_duplicates("type").sample(200, random_state=42).bodyId.values
)
nl
<class 'navis.core.neuronlist.NeuronList'> containing 200 neurons (12.3MiB)
               type            name     id  ...   cable_length soma        units
0    navis.Skeleton          FB2L_L  17749  ...  224793.843750    1  8 nanometer
1    navis.Skeleton  P6-8P9(PB14)_L  94391  ...   81555.570312    2  8 nanometer
..              ...             ...    ...  ...            ...  ...          ...
198  navis.Skeleton        FB4A_a_L  92683  ...  192589.781250    4  8 nanometer
199  navis.Skeleton          ExR8_L  15458  ...  253509.984375    2  8 nanometer
Layout 1: the grid#
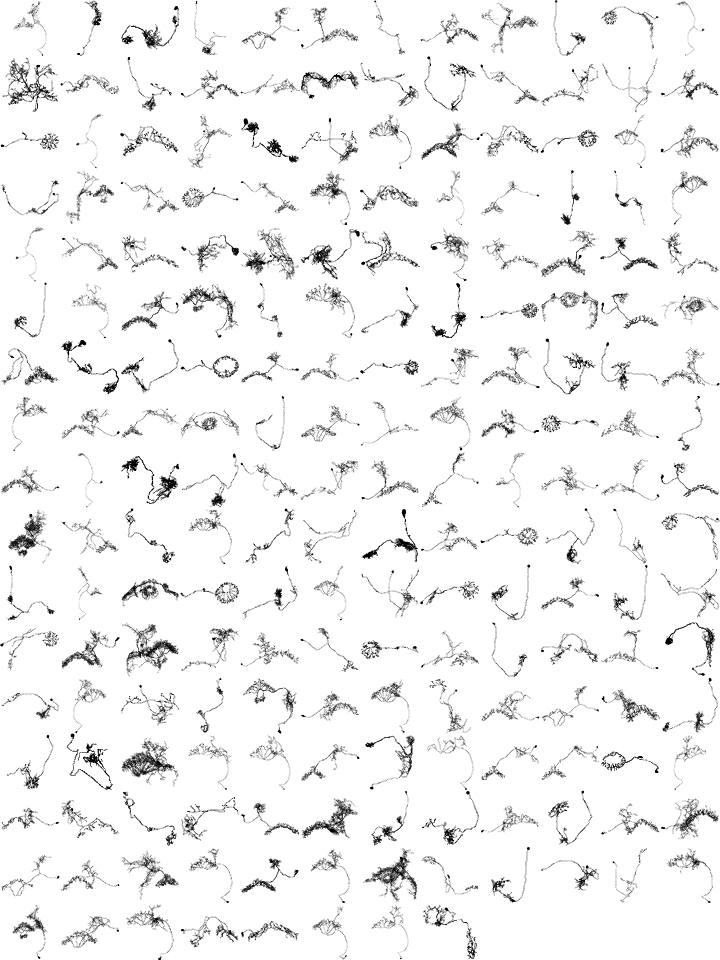
The default. One neuron per cell, scaled to fill it:
fig, ax, placed = navis.plot_collage(nl, page_size=(6, 8), radius="lw", color="k")
Two arguments there are worth a word before we go on:
page_size and radius
page_size is the figure size in inches and defaults to A4 - which, at the default dpi=300, is a 2481 × 3507 pixel figure. That is the right call for something you intend to print, but it makes for unwieldy plots on screen, so everything here uses a smaller (6, 8) page.
radius="lw" maps each node's radius onto the line width instead of outlining a tube. On a page with this much cable on it that reads much better than flat lines, for a fraction of the file size of radius=True - see the skeleton plotting tutorial.
The grid takes five arguments:
| Parameter | Default | Effect |
|---|---|---|
cols | None | Number of columns. None picks whatever makes the cells as square as possible. |
margin | 0.05 | Fraction of each cell left free around the neuron. |
uniform_scale | False | Scale all neurons by the same factor instead of fitting each to its cell. |
sort | False | Sort by size, largest first. |
drop_dangling | False | Drop neurons off the end until the last row is full. |
Keeping relative sizes#
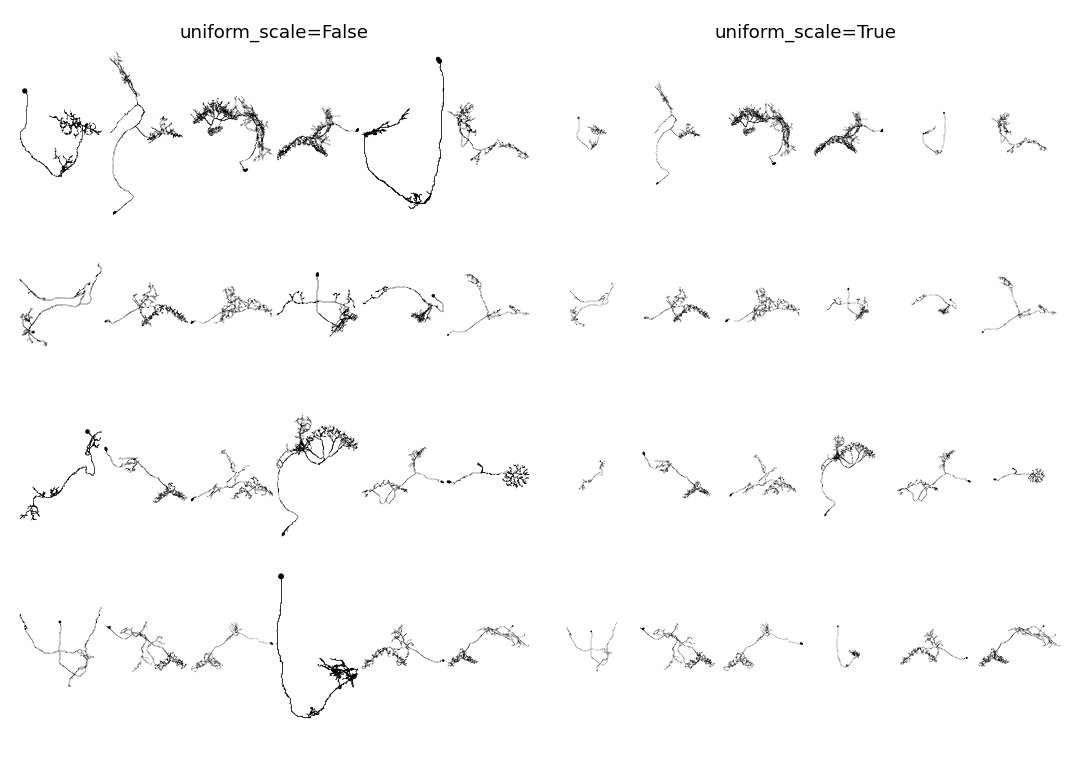
By default each neuron is blown up until it fills its cell, so a small neuron and a large one end up looking the same size. uniform_scale=True scales all of them by the same factor instead - the two side by side:
sub = nl.sample(24, random_state=1)

navis.plot_collage(sub, cols=6, uniform_scale=True, page_size=(4.5, 6), radius="lw", color="k")
radius and uniform_scale go together
Scaling a neuron scales its radii too. With the default uniform_scale=False every neuron gets its own factor, so the line widths on the page are not comparable between cells - a thin neurite in a small neuron can end up thicker than a thick one in a large neuron. If you plot with radius and want the widths to mean something, use uniform_scale=True.
Filling the grid#
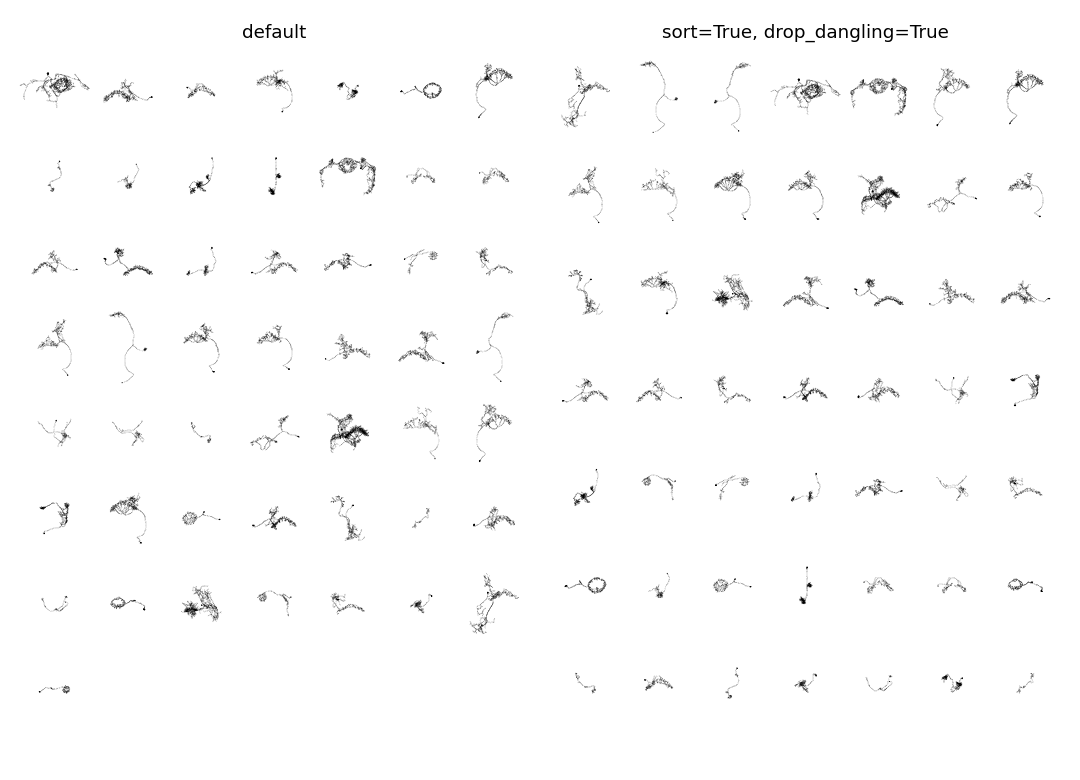
50 neurons into 7 columns leaves one lonely neuron on the last row (left, below). sort=True orders them by size and drop_dangling=True drops as many off the end as it takes to fill the grid exactly - together, that means the ones dropped are the smallest (right):
sub50 = nl.sample(50, random_state=2)

navis.plot_collage(
    sub50,
    cols=7,
    uniform_scale=True,
    sort=True,
    drop_dangling=True,
    page_size=(4.5, 6),
    radius="lw",
    color="k",
)
INFO : Dropping 1 neuron(s) to fill the grid: 49 of 50 plotted.
Layout 2: dense#
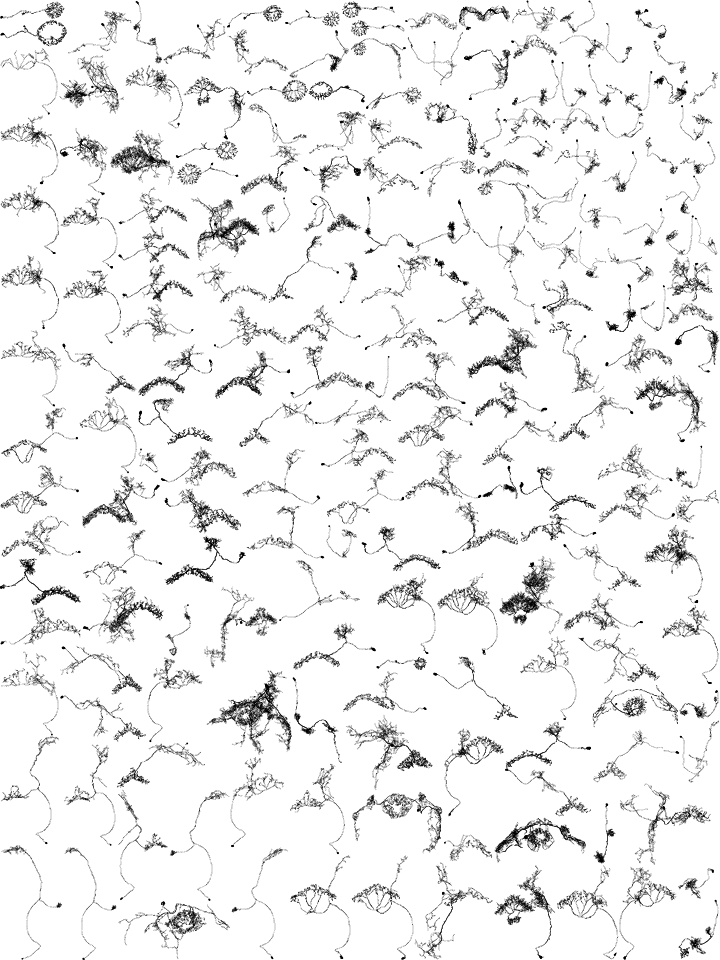
A grid gives every neuron the same amount of paper whether it needs it or not. layout="dense" instead packs the neurons as tightly as they will go, at one common scale - so their relative sizes survive:
fig, ax, placed = navis.plot_collage(
    nl, layout="dense", page_size=(6, 8), radius="lw", color="k"
)
How the scale is found
There is no way to compute the largest scale that still fits - so NAVis searches for it. It packs the neurons at some scale, asks whether they fit, and bisects: too big, halve it; fits, try bigger. iterations (default 18) is how many of those steps it takes, and the last one that fit is the page you get. The packing itself is done by navis-fastcore.
Packing the arbors instead of the boxes#
Look at the page above and you will notice it is not really dense: the packing is done on each neuron's bounding box, and a neuron fills very little of its own box. Everything inside that box is reserved for one neuron, empty or not.
occupancy=True packs the rasterised arbors instead. A neuron may then reach into another's empty space - even into the loop of another neuron - as long as no cable actually collides:
fig, ax, placed = navis.plot_collage(
    nl, layout="dense", occupancy=True, page_size=(6, 8), radius="lw", color="k"
)
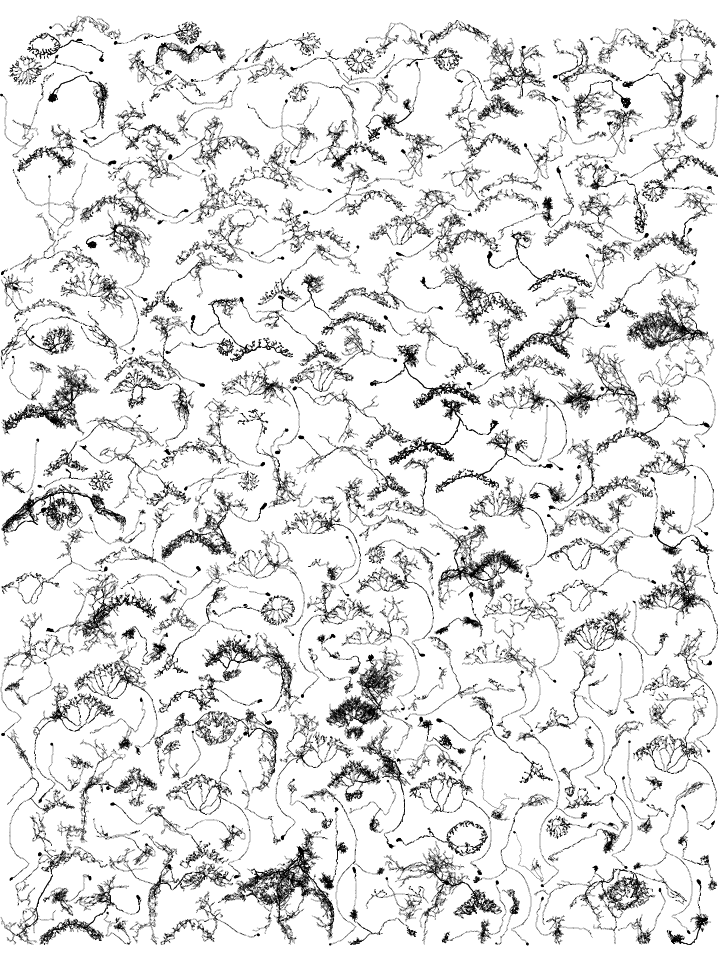
Same 200 neurons, same page: packing the arbors draws each of them 1.37× larger than packing their boxes did - close to twice the area per neuron.
It can only improve on the boxes
The box packing runs first either way and hands its scale to the occupancy search as a starting point, so occupancy=True never does worse than occupancy=False - it just costs more time. Turn occupancy_res (default 100 px per page unit) up for a more precise fit, down for a faster one.
Padding and rotation#
| Parameter | Default | Effect |
|---|---|---|
padding | 0.02 | Gap kept between neurons, in page units. Raise it to let the page breathe, lower it to squeeze. |
allow_rotation | False | Let neurons be turned by 90° if that packs tighter. |
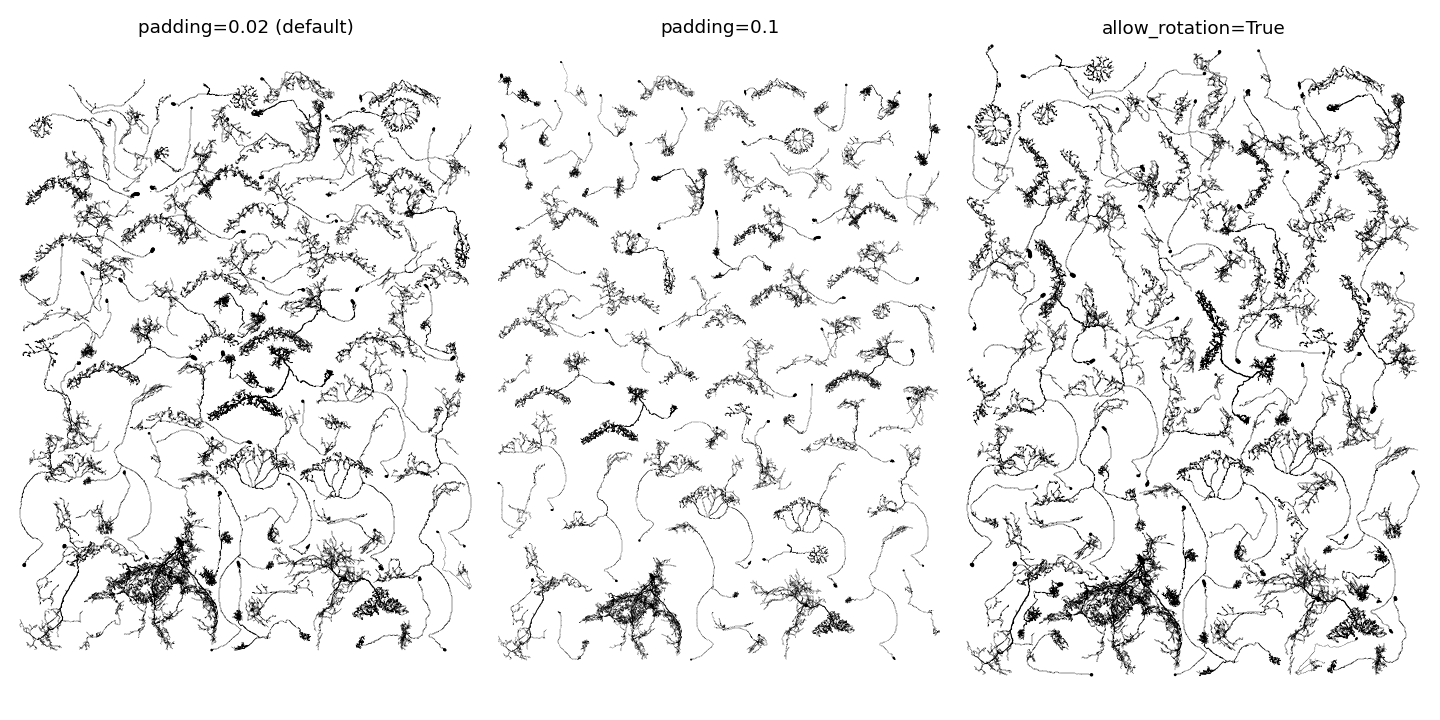
On 60 of our neurons, padding=0.1 costs ~24% of the scale and allow_rotation=True buys back ~7% (default, padding and rotation, left to right below):
sub60 = nl.sample(60, random_state=3)

navis.plot_collage(
    sub60,
    layout="dense",
    occupancy=True,
    allow_rotation=True,  # or: padding=0.1
    page_size=(3.6, 5),
    radius="lw",
    color="k",
)
Filling the gaps: backfill#
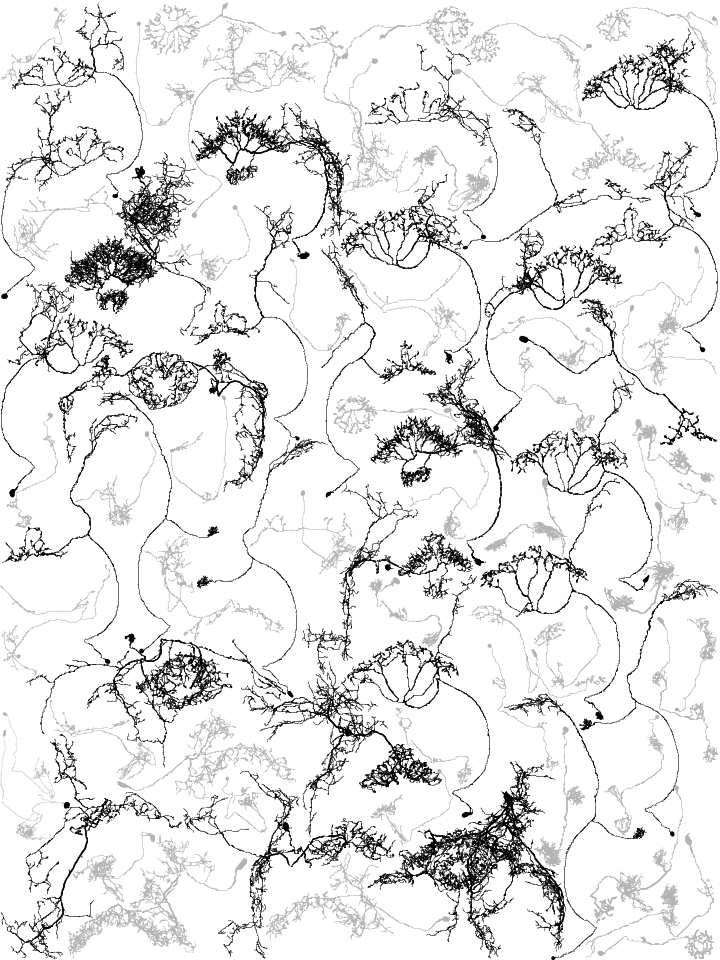
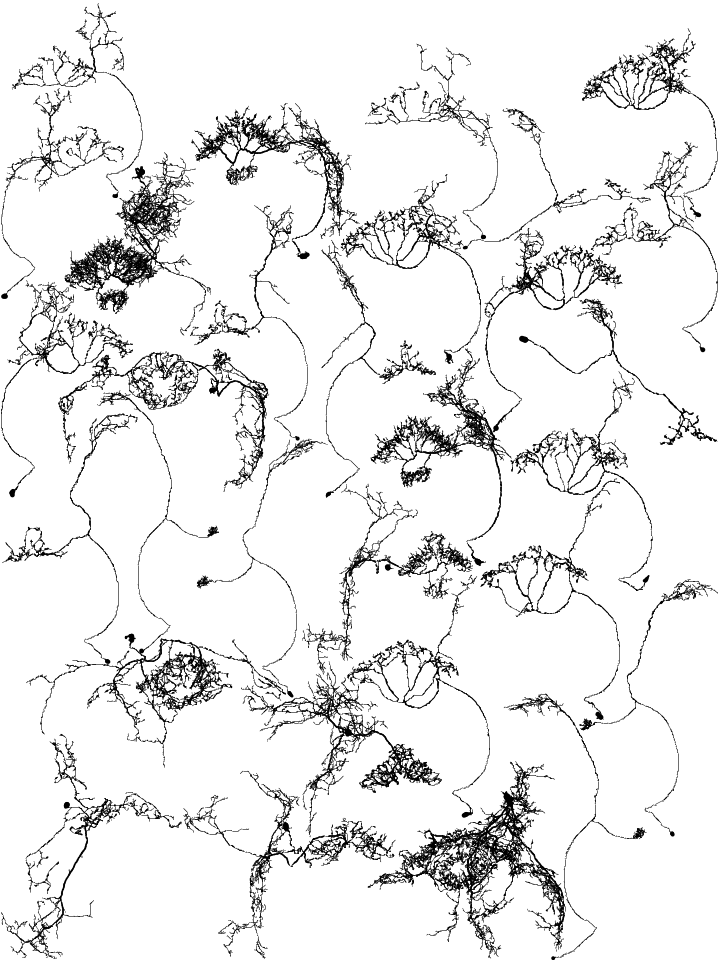
Even packed by occupancy there are holes left, and often you have neurons you would like to show but do not need to. That is what backfill is for: those neurons are packed into whatever room is left over once x is placed. They do not influence the scale, and any that find no gap are silently dropped.
Here the 30 largest neurons carry the page (black) and the remaining 170 are offered as backfill (grey):
import numpy as np

# Order by bounding box area in the plane we are plotting
bbox = np.array([n.bbox for n in nl])
by_size = nl[np.argsort(-np.prod(bbox[:, :2, 1] - bbox[:, :2, 0], axis=1))]

main, rest = by_size[:30], by_size[30:]

fig, ax, placed = navis.plot_collage(
    main,
    layout="dense",
    backfill=rest,
    occupancy=True,
    page_size=(6, 8),
    radius="lw",
    color=["k"] * len(main) + [(0.7, 0.7, 0.7)] * len(rest),  # one color per neuron
)

print(f"{len(placed) - len(main)} of {len(rest)} backfill neurons fit")
51 of 170 backfill neurons fit
Order does not matter
Backfill neurons are tried largest first, so the order you hand them in is irrelevant. Note that color now needs len(x) + len(backfill) entries - the colors of dropped neurons are dropped with them.
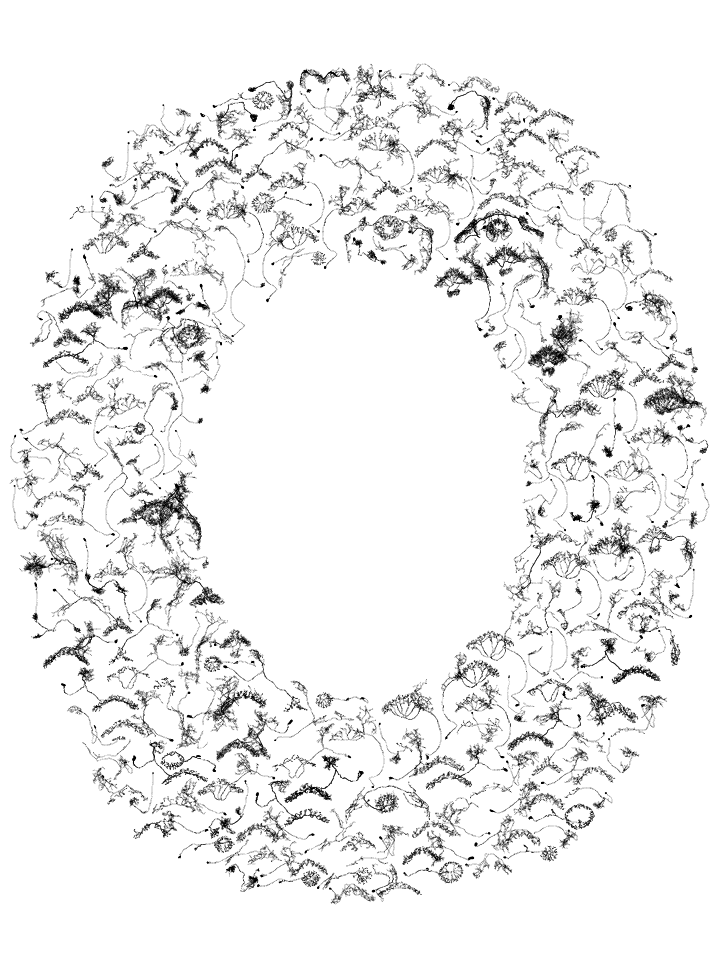
Packing into a shape: mask#
mask confines the neurons to an outline. It takes a bool array covering the page - True where neurons are allowed, row 0 at the bottom - which is resampled to the packing grid, so its resolution does not have to match anything:
# A ring: neurons allowed between 45% and 98% of the way out
h, w = 800, 600
yy, xx = np.mgrid[0:h, 0:w]
r = np.hypot((xx - w / 2) / (w / 2), (yy - h / 2) / (h / 2))
mask = (r < 0.98) & (r > 0.45)

fig, ax, placed = navis.plot_collage(
    nl, layout="dense", mask=mask, page_size=(6, 8), radius="lw", color="k"
)
Masks always pack by occupancy
Bounding boxes cannot follow an arbitrary outline, so a mask implies occupancy=True - there is no box layout to start the search from, which makes it a bit slower than the plain dense layout. The neurons are laid down from the middle of the shape outwards; filling bottom-up, as the unmasked layouts do, would leave the top of the shape bare.
mask also takes a picture of the shape - a file path or the pixels - which is scaled onto the page with dark counting as the shape:
fig, ax, placed = navis.plot_collage(nl, layout="dense", mask="my_silhouette.png")
Colors#
color is either one color for all neurons or one per neuron, in the order of x. Colors follow their neurons through whatever the layout does with them - sort reorders them, drop_dangling and a dropped backfill neuron take their color along.
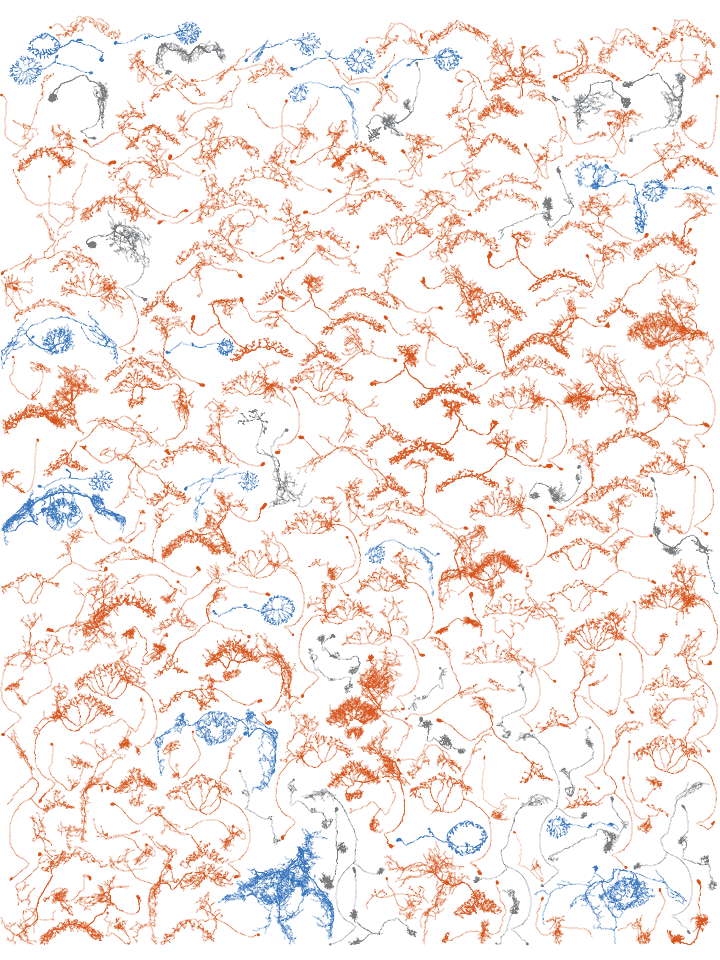
Let's color our CX neurons by the structure their name points at:
PALETTE = {"FB": (0.85, 0.33, 0.10), "EB": (0.20, 0.45, 0.75), "other": (0.45, 0.45, 0.45)}
GROUPS = {"FB": ("FB", "FC", "FS", "FR", "hDelta", "vDelta"), "EB": ("ER", "ExR", "EL", "EP")}


def group(name):
    for grp, prefixes in GROUPS.items():
        if name.startswith(prefixes):
            return grp
    return "other"


colors = [PALETTE[group(n.name)] for n in nl]

fig, ax, placed = navis.plot_collage(
    nl, layout="dense", occupancy=True, page_size=(6, 8), radius="lw", color=colors
)
color_by works too
Anything plot_collage does not recognise is handed straight to navis.plot2d, including color_by/palette - see the coloring tutorial. The placed copies keep the properties of the originals, so coloring by a node column or a neuron property works exactly as it does anywhere else.
Re-using a layout#
The third return value, placed, holds the scaled and moved copies in the order they were plotted. Hand them back in as placed= and the layout is skipped entirely - the same page, re-drawn:
# Re-plot the page we just packed, in a different color
fig, ax, _ = navis.plot_collage(placed=placed, page_size=(6, 8), radius="lw", color="k")
view and page_size still apply
Every layout parameter is ignored when you pass placed, but view and page_size are not - they have to match the ones the neurons were laid out with, or the page will not line up.
That is worth knowing because packing 200 arbors by occupancy takes a few seconds, and you will rarely get the colors right first time. It is also how you swap the renderer without re-packing:
backend | How it draws | Trade-off |
|---|---|---|
"matplotlib" (default) | every neuron as vector paths via navis.plot2d | scalable and editable afterwards, but the file grows with the amount of cable on the page |
"octarine" | renders the page offscreen via navis.plot3d(snapshot=True) and places the image | fixed size no matter how dense the page (160 neurons: 8.9 MB of SVG against 1.0 MB), and shades meshes the way the interactive viewer does |
fig, ax, _ = navis.plot_collage(placed=placed, backend="octarine", page_size=(6, 8))
Either way you get a matplotlib figure back with the neurons in their own coordinates, so a page looks the same whichever one drew it - and annotations, scale bars or an inset land in the same place.
Where to next#
Total running time of the script: ( 0 minutes 0.000 seconds)
Download Python source code: zzz_tutorial_plotting_misc_04_collage.py
Download Jupyter notebook: zzz_tutorial_plotting_misc_04_collage.ipynb