Note
Click here to download the full example code
Plotting Overview#
Which plotting mode and which backend to reach for, and how they compare.
NAVis draws neurons two ways: static 2D figures via matplotlib, and interactive 3D scenes via octarine, plotly or k3d. Which one you want depends on what you are making - a figure for a paper, or a scene to fly around in while you work something out - and on where you are running it.
graph LR
A{"What are you<br>making?"} -->|a figure| B["navis.plot2d()"]
A -->|exploring| C["navis.plot3d()"]
B --> D["matplotlib<br>vector output"]
C --> E{"where?"}
E -->|terminal or Jupyter| F["octarine"]
E -->|notebook to share| G["plotly"]
E -->|notebook, in-memory| H["k3d"]
F -.->|snapshot=True| D| Backend | Used in | Pros | Cons |
|---|---|---|---|
| matplotlib | navis.plot2dnavis.plot1dnavis.plot_flat | - high quality (vector graphics!) - works in Jupyter and terminal - exports to vector graphics - myriads of ways to adjust plots | - fakes depth rather than rendering it - not very interactive (although you can adjust perspective) - slow for very large scenes - not good for voxel data (e.g. image volumes) |
| octarine | navis.plot3d | - blazingly fast thanks to WGPU backend - works in terminal and Jupyter - very interactive - renders straight to a figure with snapshot=True | - may not work on older systems (use plotly instead)- not persistent (i.e. dies with notebook kernel) - can't share interactive plot (screenshots only) |
| plotly | navis.plot3d | - works "inline" for Jupyter environments - persistent (i.e. plots get saved alongside notebook) - can produce offline HTML plots for sharing | - not very fast for large scenes - large file sizes (i.e. makes for large .ipynb notebook files)- horrendous for voxel data (i.e. images) |
| k3d | navis.plot3d | - works "inline" for Jupyter environments - super fast and performant - in memory (i.e. does not increase notebook file size) | - does not work in terminal sessions - not persistent (i.e. dies with notebook kernel) - can't share interactive plot (screenshots only) |
In theory there is feature parity across backends but due to built-in limitations there are minor differences. If you installed NAVis via pip install navis[all] all of the above should be available; with a minimal pip install navis you may need to install backends separately - NAVis will complain if you ask for one that is missing.
Note
The plots in this tutorial are optimized for light-mode. If you are using dark-mode, you may have trouble seeing e.g. axis or labels.
2D plots#
navis.plot2d uses matplotlib, which means vector output you can drop straight into a figure. Its weak spot is depth: matplotlib has no real renderer, so objects are layered by z-order rather than properly occluded. NAVis does a lot of work to hide that (culling, depth sorting, shading - see the 2D tutorials), but it is worth knowing what is going on underneath.
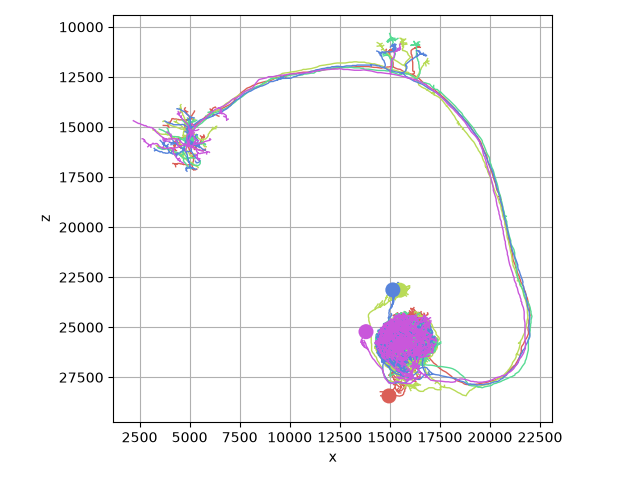
Let's start with the defaults:
import navis
import matplotlib.pyplot as plt
nl = navis.example_neurons(kind="skeleton")
# Plot using default settings
fig, ax = navis.plot2d(nl, view=("x", "-z"), method="2d")
plt.tight_layout()
Note
We set view=("x", "-z") above to get a frontal view of the example neurons. You may need to adjust this depending on the orientation of your neurons.
The three methods#
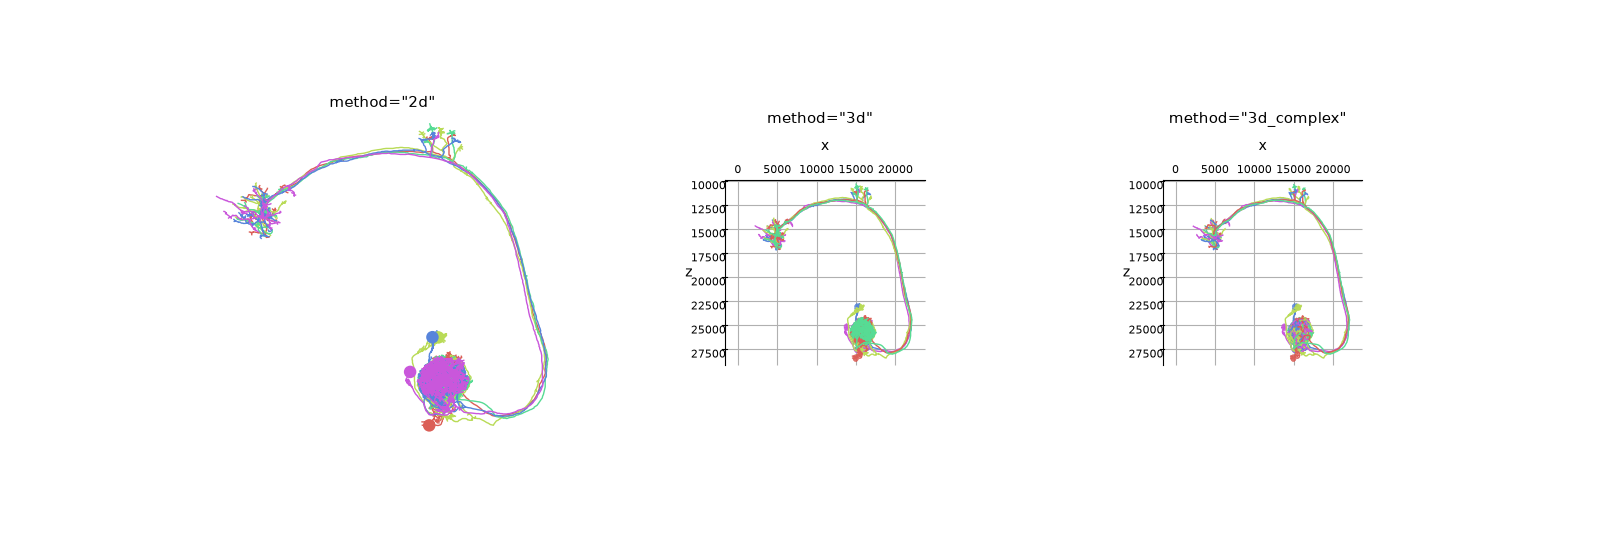
plot2d has three rendering modes. The default "2d" projects everything into the view plane itself; the other two hand the geometry to matplotlib's 3D axes, which lets you rotate the result afterwards:
method | Axes | Rotatable | Notes |
|---|---|---|---|
"2d" | 2D | no | Default. Fastest, smallest vector output, and the only mode with shading, halos and depth sorting |
"3d" | 3D | yes | matplotlib decides the z-order per collection |
"3d_complex" | 3D | yes | Each segment added separately for better z-order - slow |
# `method="2d"` needs a plain axis and the other two a 3d one, so add them one at a time
fig = plt.figure(figsize=(16, 5.5))
ax = fig.add_subplot(1, 3, 1)
navis.plot2d(nl, method="2d", view=("x", "-z"), ax=ax)
ax.set_title('method="2d"', fontsize=11, y=0.98)
ax.set_axis_off()
for i, method in enumerate(("3d", "3d_complex"), start=2):
ax = fig.add_subplot(1, 3, i, projection="3d")
navis.plot2d(nl, method=method, view=("x", "-z"), ax=ax)
ax.set_title(f'method="{method}"', fontsize=11, y=0.98)
# a 3d axis is drawn small inside its slot, so the default tick density
# collides with itself
ax.set_xticks(ax.get_xticks()[::2])
ax.tick_params(labelsize=8)
With a 3D axis you can change the viewing angle after the fact by setting elev, azim and roll - see matplotlib's explanation:
fig, ax = nl.plot2d(
method="3d_complex", view=("x", "-z"), non_view_axes3d="show", radius=True
)
# Change view to see the neurons from a different angle
ax.elev = -20
ax.azim = 45
ax.roll = 180
plt.tight_layout()
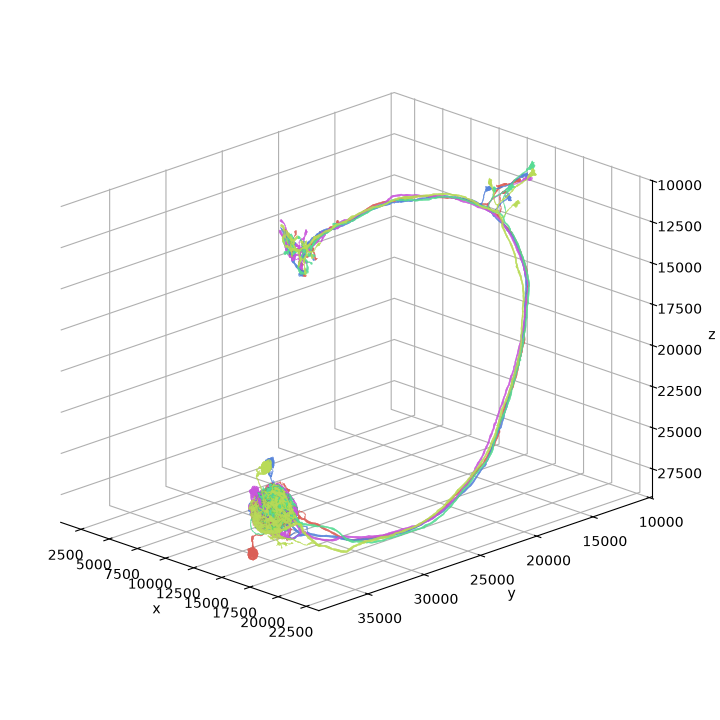
Note
Note the non_view_axes3d="show" above. By default NAVis hides the axis parallel to the viewing direction so it does not clutter the image; since we were going to rotate, we asked for it back. If the plot renders in a separate window (e.g. running Python from a terminal) you can drag to change the perspective.
That also gives you a cheap way to make an animation:
# Render 3D rotation
for i in range(0, 360, 10):
# Change rotation
ax.azim = i
# Save each incremental rotation as frame
plt.savefig('frame_{0}.png'.format(i), dpi=200)
3D plots#
By "3D plots" we mean genuinely interactive scenes, as opposed to the (mostly) static 2D output above. They are what you want while exploring - and, with snapshot=True, they can produce publication images too.
| backend | Jupyter | Terminal |
|---|---|---|
| octarine | yes | yes |
| plotly | yes | yes but only via export to html |
| k3d | yes | no |
By default the choice is automatic and depends on (1) which backends are installed and (2) the context. The first available backend in each row wins:
| Context | Backend priority (first available wins) |
|---|---|
| IPython / Terminal / scripts | octarine plotly |
| Jupyter Lab / Notebook | plotly octarine k3d |
Force one with the backend parameter:
n = navis.example_neurons()
navis.plot3d(n)
n = navis.example_neurons()
navis.plot3d(n, backend='octarine')
n = navis.example_neurons()
navis.plot3d(n, backend='plotly')
n = navis.example_neurons()
navis.plot3d(n, backend='k3d')
... or set a default via an environment variable:
export NAVIS_PLOT3D_BACKEND="octarine"
Google Colaboratory
The jupyter_rfb that Octarine uses to render 3D plots in Jupyter does not work in Google Colaboratory. There, use the plotly backend instead.
Octarine#
Octarine works through a Viewer object you can keep adding to, removing from and recolouring. It uses modern WGPU (rather than OpenGL), which makes it fast even for large scenes:
nl = navis.example_neurons()
viewer = navis.plot3d(nl, backend='octarine')
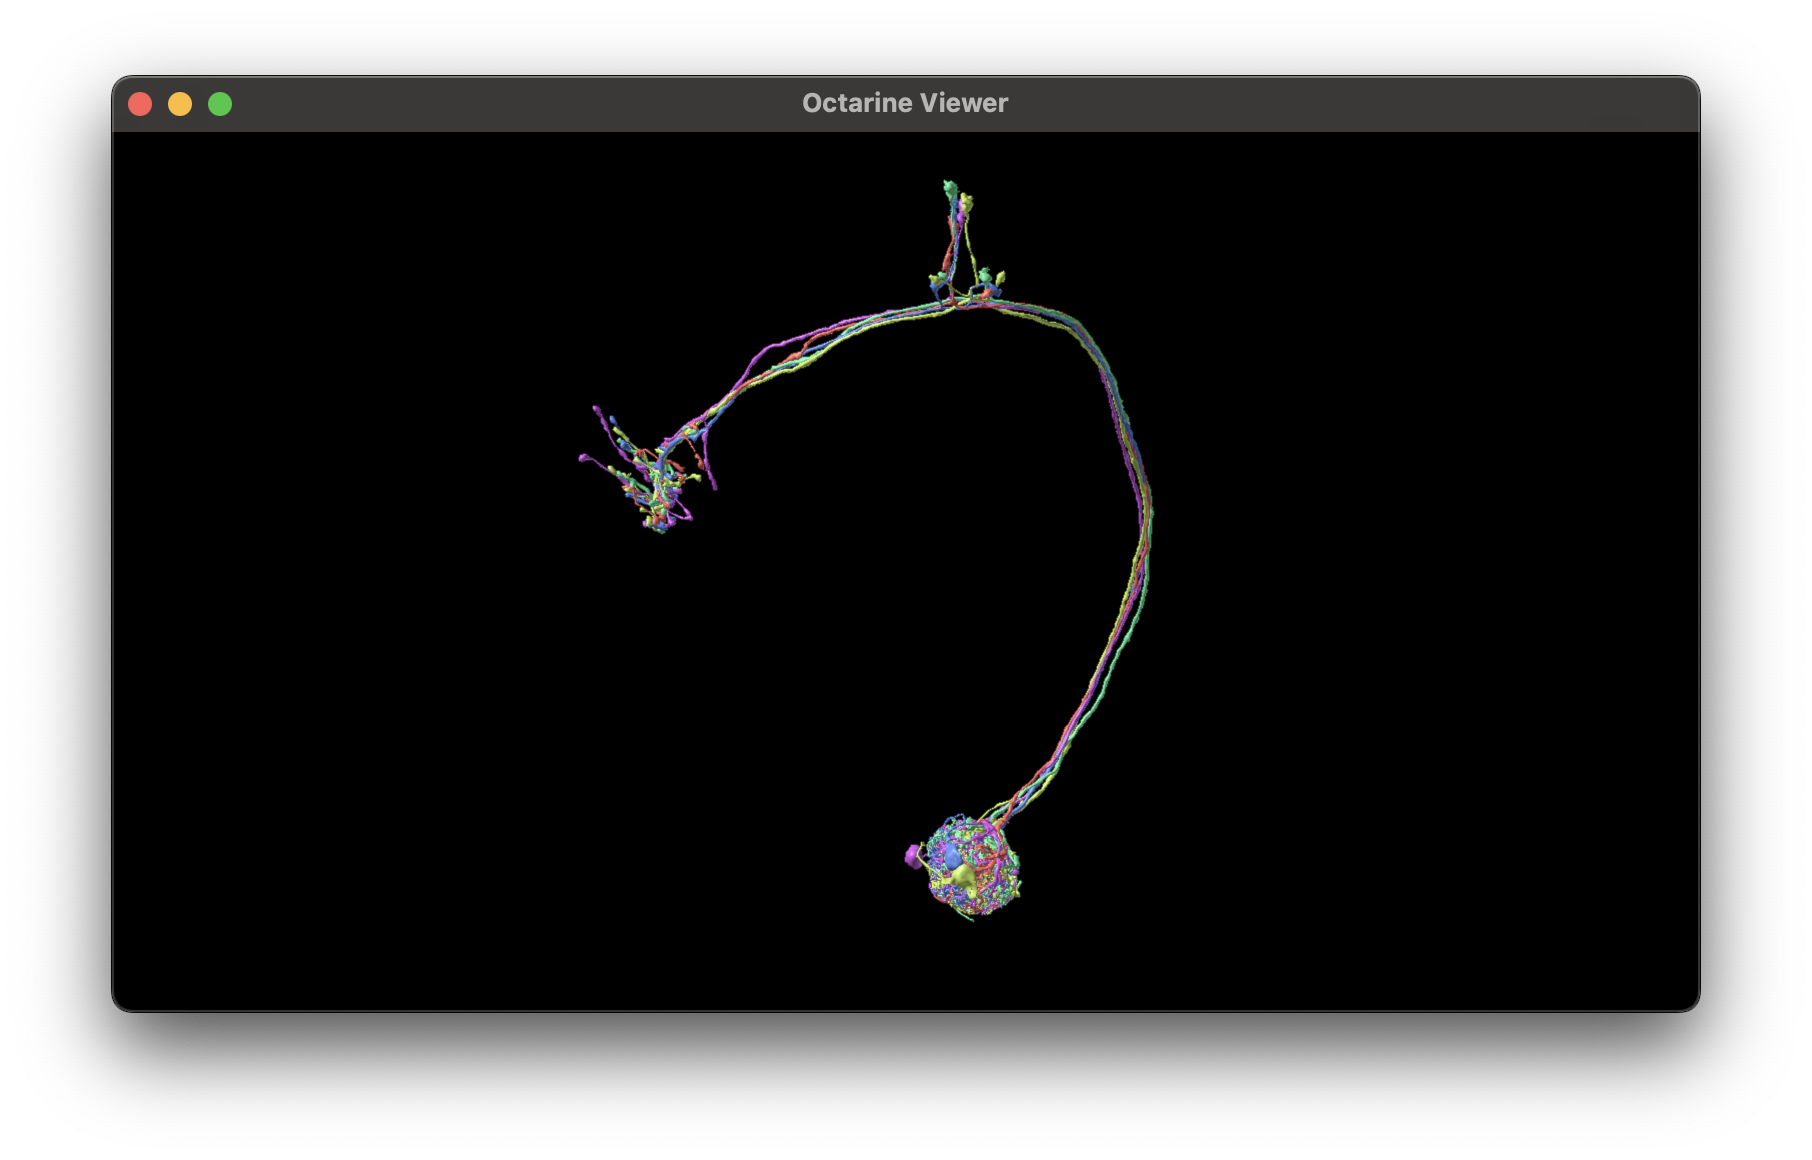
Showing the viewer in Jupyter
From Jupyter, you may need to call viewer.show() in the last line of the cell for the Octarine widget to appear.
A few things to know:
- The
vieweris dynamic - keep adding/removing items from other cells - but it dies with the kernel (unlikeplotly)! - NAVis tracks a "primary" viewer; subsequent
navis.plot3dcalls add to it. Force a new one withnavis.plot3d(nl, viewer='new')or target a specific one withnavis.plot3d(nl, viewer=viewer). - You can resize the canvas (in Jupyter by dragging the lower right corner).
- In Jupyter, rendering runs in your kernel and frames are streamed via a remote frame buffer (
jupyter_rfb); a remote kernel may add some lag.
Some important methods for the viewer object:
viewer.close() # (1)!
navis.close3d() # (2)!
navis.plot3d(nl) # (3)!
navis.plot3d(nl, viewer=viewer) # (4)!
viewer.clear3d() # (5)!
navis.clear3d() # (6)!
- Close the viewer.
- Close the current primary viewer.
- Add neurons to the primary viewer.
- Add neurons to a specific viewer.
- Clear the viewer.
- Clear the primary viewer.
The Octarine viewer has many more neat features - check out its documentation to learn more.
Snapshots: 3D quality, matplotlib output#
snapshot=True renders the octarine scene offscreen and hands you a matplotlib (fig, ax) with the image on it. You get a real renderer's occlusion and lighting, in a figure you can annotate, compose into subplots and save like any other:
navis.plot3d(nl, snapshot=True, view=("x", "-z"))
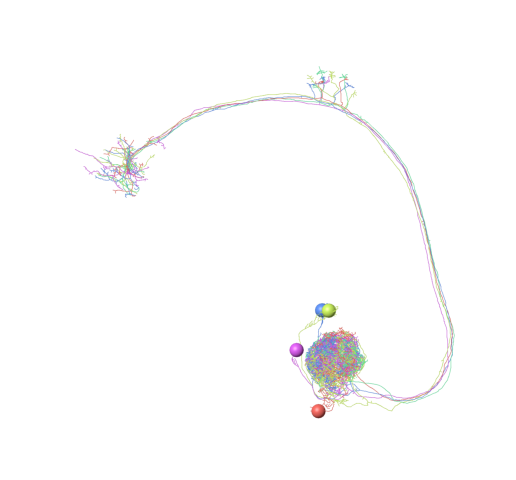
Out:
(<Figure size 516.824x480 with 1 Axes>, <Axes: >)
Because the image is placed in data coordinates, you can keep working in the neurons' own coordinate system afterwards - labels, arrows and overlays all land where you expect:
fig, ax = navis.plot3d(nl, snapshot=True, view=("x", "-z"), figsize=(7, 7))
soma = nl[0].soma_pos[0]
ax.scatter(soma[0], soma[2], s=120, facecolor="none", edgecolor="crimson", lw=2, zorder=5)
ax.annotate(
"soma",
xy=(soma[0], soma[2]),
xytext=(soma[0] - 6_000, soma[2] - 3_000),
color="crimson",
arrowprops=dict(arrowstyle="->", color="crimson"),
)
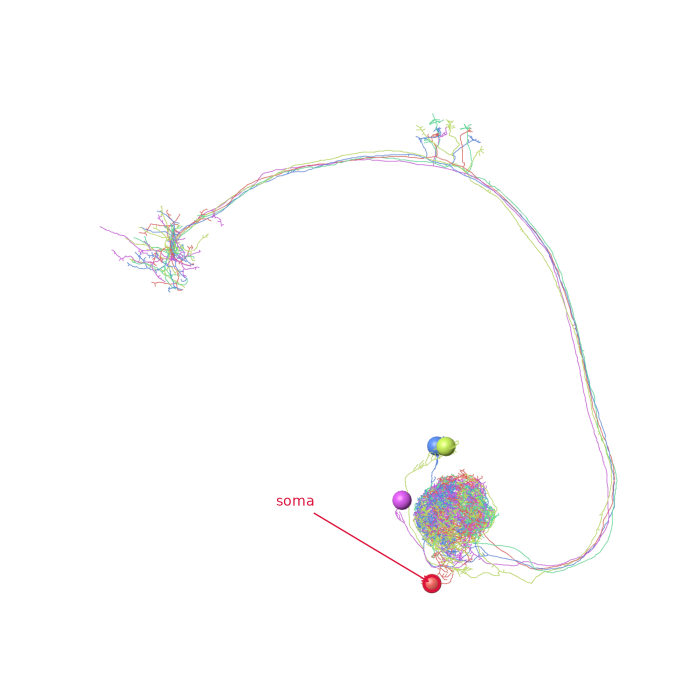
Out:
Text(8957.099609375, 25432.400390625, 'soma')
Snapshots are the backbone of the 3D tutorials
Every side-by-side comparison in the 3D section is built this way: one plot3d(..., snapshot=True, ax=...) per panel. It needs the octarine backend, and it works headlessly - so it is also how you render 3D figures from a script or on a cluster.
K3d#
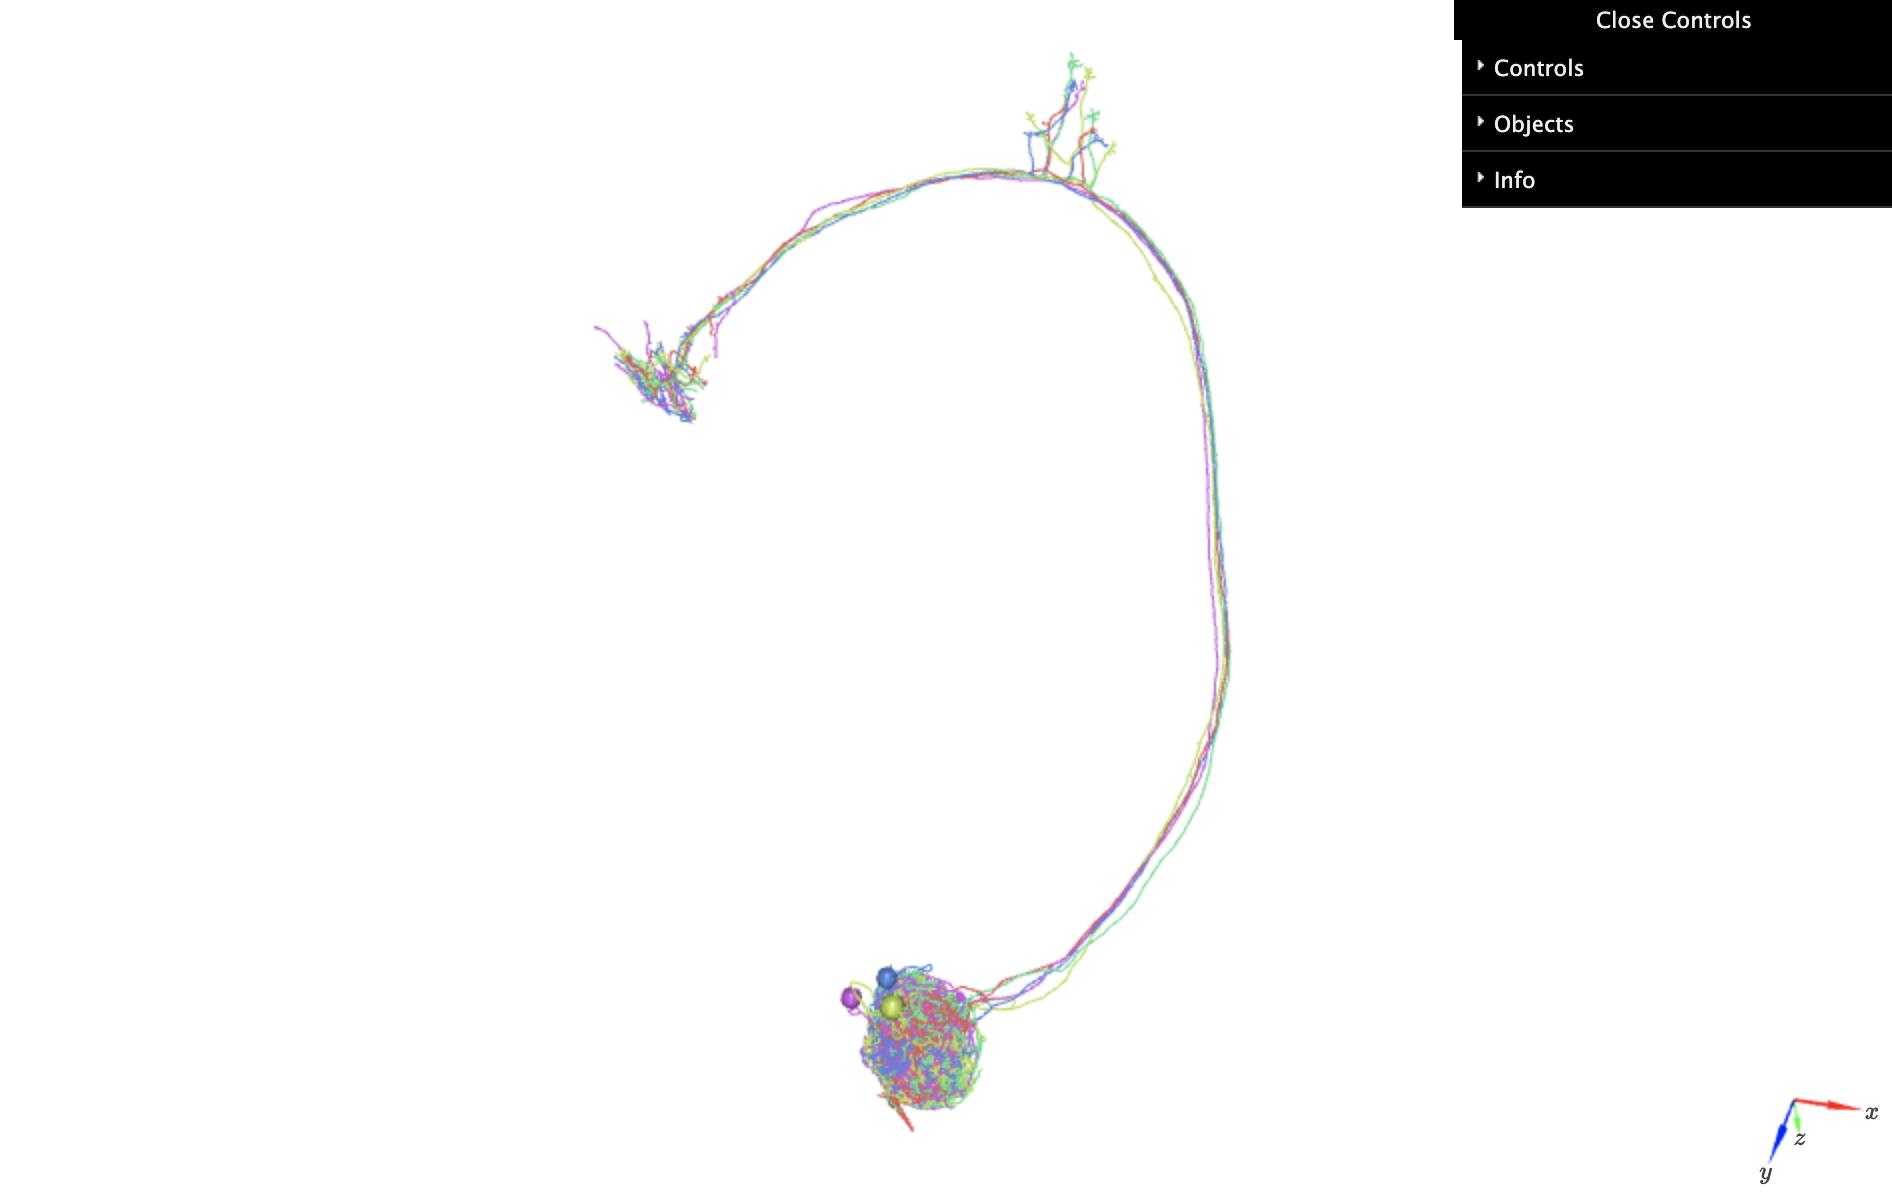
k3d plots work in Jupyter (and only there) but, unlike plotly, do not persist across sessions. Almost anything you can do with plotly you can also do with k3d (or octarine):
p = navis.plot3d(nl, backend="k3d")
Plotly#
plotly is the only backend whose interactive plots can be embedded in this documentation. It works inline in Jupyter notebooks and exports to standalone HTML. The downsides are speed on large scenes and the size of the resulting .ipynb files.
Plotly generates "inline" plots by default:
navis.plot3d(
nl,
backend="plotly",
connectors=False,
radius=True, # use node radii for skeletons
legend_orientation="h", # horizontal legend (more space for plot)
)