"""
Skeletons from light-level data
===============================
Extract skeletons from confocal microscopy image stacks.
!!! important "This example is not executed"
In contrast to almost all other tutorials, this one is not executed when the documentation is built.
Consequently, it also does not display any actual code output or plots - images shown are statically
embedded. The main reason for this is that the example requires downloading a large-ish file which
is a pain in the neck to get to work in the CI environment.
Extracting neuron skeletons from microscopy data is a common but non-trivial task. There are about
as many ways to do this as there are people doing it - from fully manual to fully automated tracing.
This tutorial walks through a fully automated pipeline built from a few easy-to-install Python
packages. If it isn't for you, check out the [Alternatives](#alternatives) at the end.
```mermaid
graph LR
A[Download
H5J stack] -->|"Fiji"| B[NRRD file];
B -->|"nrrd.read()"| C[Threshold];
C -->|"cc3d"| D[Label
components];
D -->|"kimimaro"| E[Skeletons];
E -->|"read_swc()"| F[NAVis neurons];
```
!!! note "Requirements"
This tutorial needs three extra packages - install them all in one go:
```shell
pip install pynrrd connected-components-3d kimimaro -U
```
- [`pynrrd`](https://github.com/mhe/pynrrd) - load NRRD image stacks
- [`connected-components-3d`](https://github.com/seung-lab/connected-components-3d) (cc3d) - label connected components
- [`kimimaro`](https://github.com/seung-lab/kimimaro) - extract the skeletons
## Preparing the data
This pipeline was designed for pre-segmented data and does little to handle noise. Fortunately, the
image stack we'll use is exceptionally clean, which keeps skeletonization straightforward.
In practice you may need to pre-process your data first. If ordinary thresholding and denoising don't
cut it, reach for more advanced segmentation tools such as [Ilastik](https://www.ilastik.org) (see its
[pixel classification](https://www.ilastik.org/documentation/pixelclassification/pixelclassification) and
[voxel segmentation](https://www.ilastik.org/documentation/voxelsegmentation/voxelsegmentation) tutorials)
or [DeepImageJ](https://deepimagej.github.io/).
### Download Image Stack
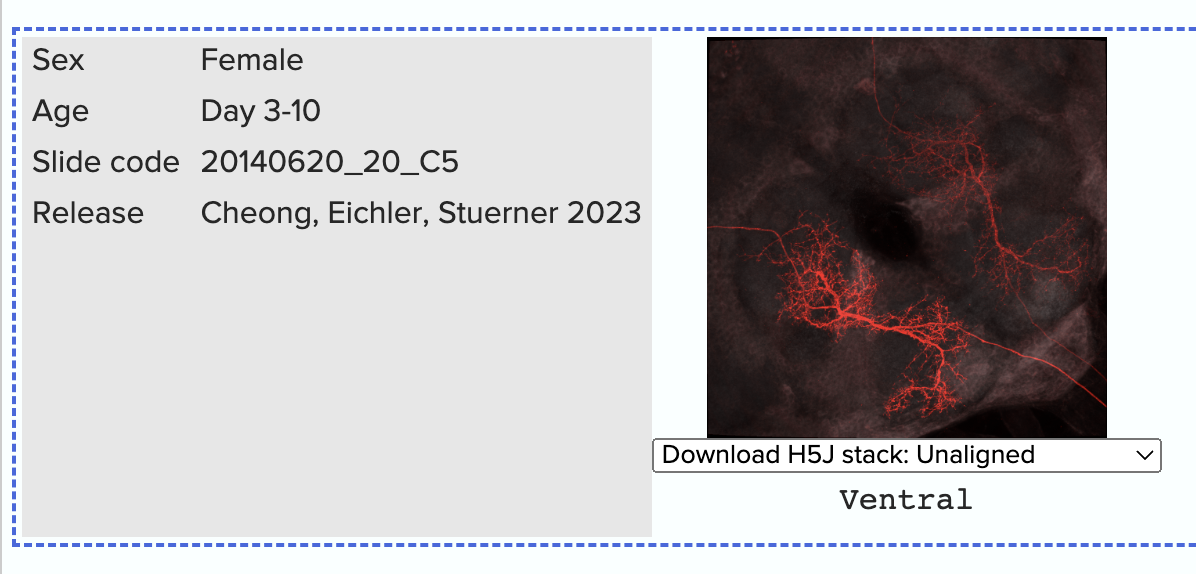
As example data, we will use a confocal stack from the [Janelia Split-Gal4 collection](https://splitgal4.janelia.org/cgi-bin/splitgal4.cgi).
We picked the [SS00731](https://flweb.janelia.org/cgi-bin/view_splitgal4_imagery.cgi?line=SS00731)
line because it's already fairly clean as is and there are high-resolution stacks
with stochastic multi-color labeling of individual neurons available for download.
Scroll all the way to the bottom of the page and in the dropdown for the left-most image,
select "Download H5J stack: Unaligned".
### Convert to NRRD
H5J isn't a format we can load directly in Python, so we first convert it to NRRD using
[Fiji/ImageJ](https://imagej.net/software/fiji/).
??? note "Converting H5J to NRRD in Fiji"
1. Fire up Fiji/ImageJ.
2. Drag & drop the `SS00731-...-unaligned_stack.h5j` file into Fiji.
3. "Image" → "Colors" → "Split Channels" to split the image into its channels.
4. Discard all but the red "C1" channel (our neurons).
5. "Image" → "Type" → "8-bit" to convert to 8-bit (optional but recommended).
6. "File" → "Save As" → "NRRD" and save as `neuron.nrrd`.

## Extracting the Skeleton
Now that we have that file in a format we can load it into Python, we can get started:
"""
# %%
import kimimaro
import nrrd
import navis
import cc3d
import numpy as np
# %%
# First load the image stack:
# `im` is numpy array, `header` is a dictionary
im, header = nrrd.read(
"neuron.nrrd"
)
# %%
# Next we pick a threshold to binarize the image. This isn't strictly necessary, but it's the
# more intuitive place to start.
# Threshold the image
mask = (im >= 20).astype(np.uint8)
# %%
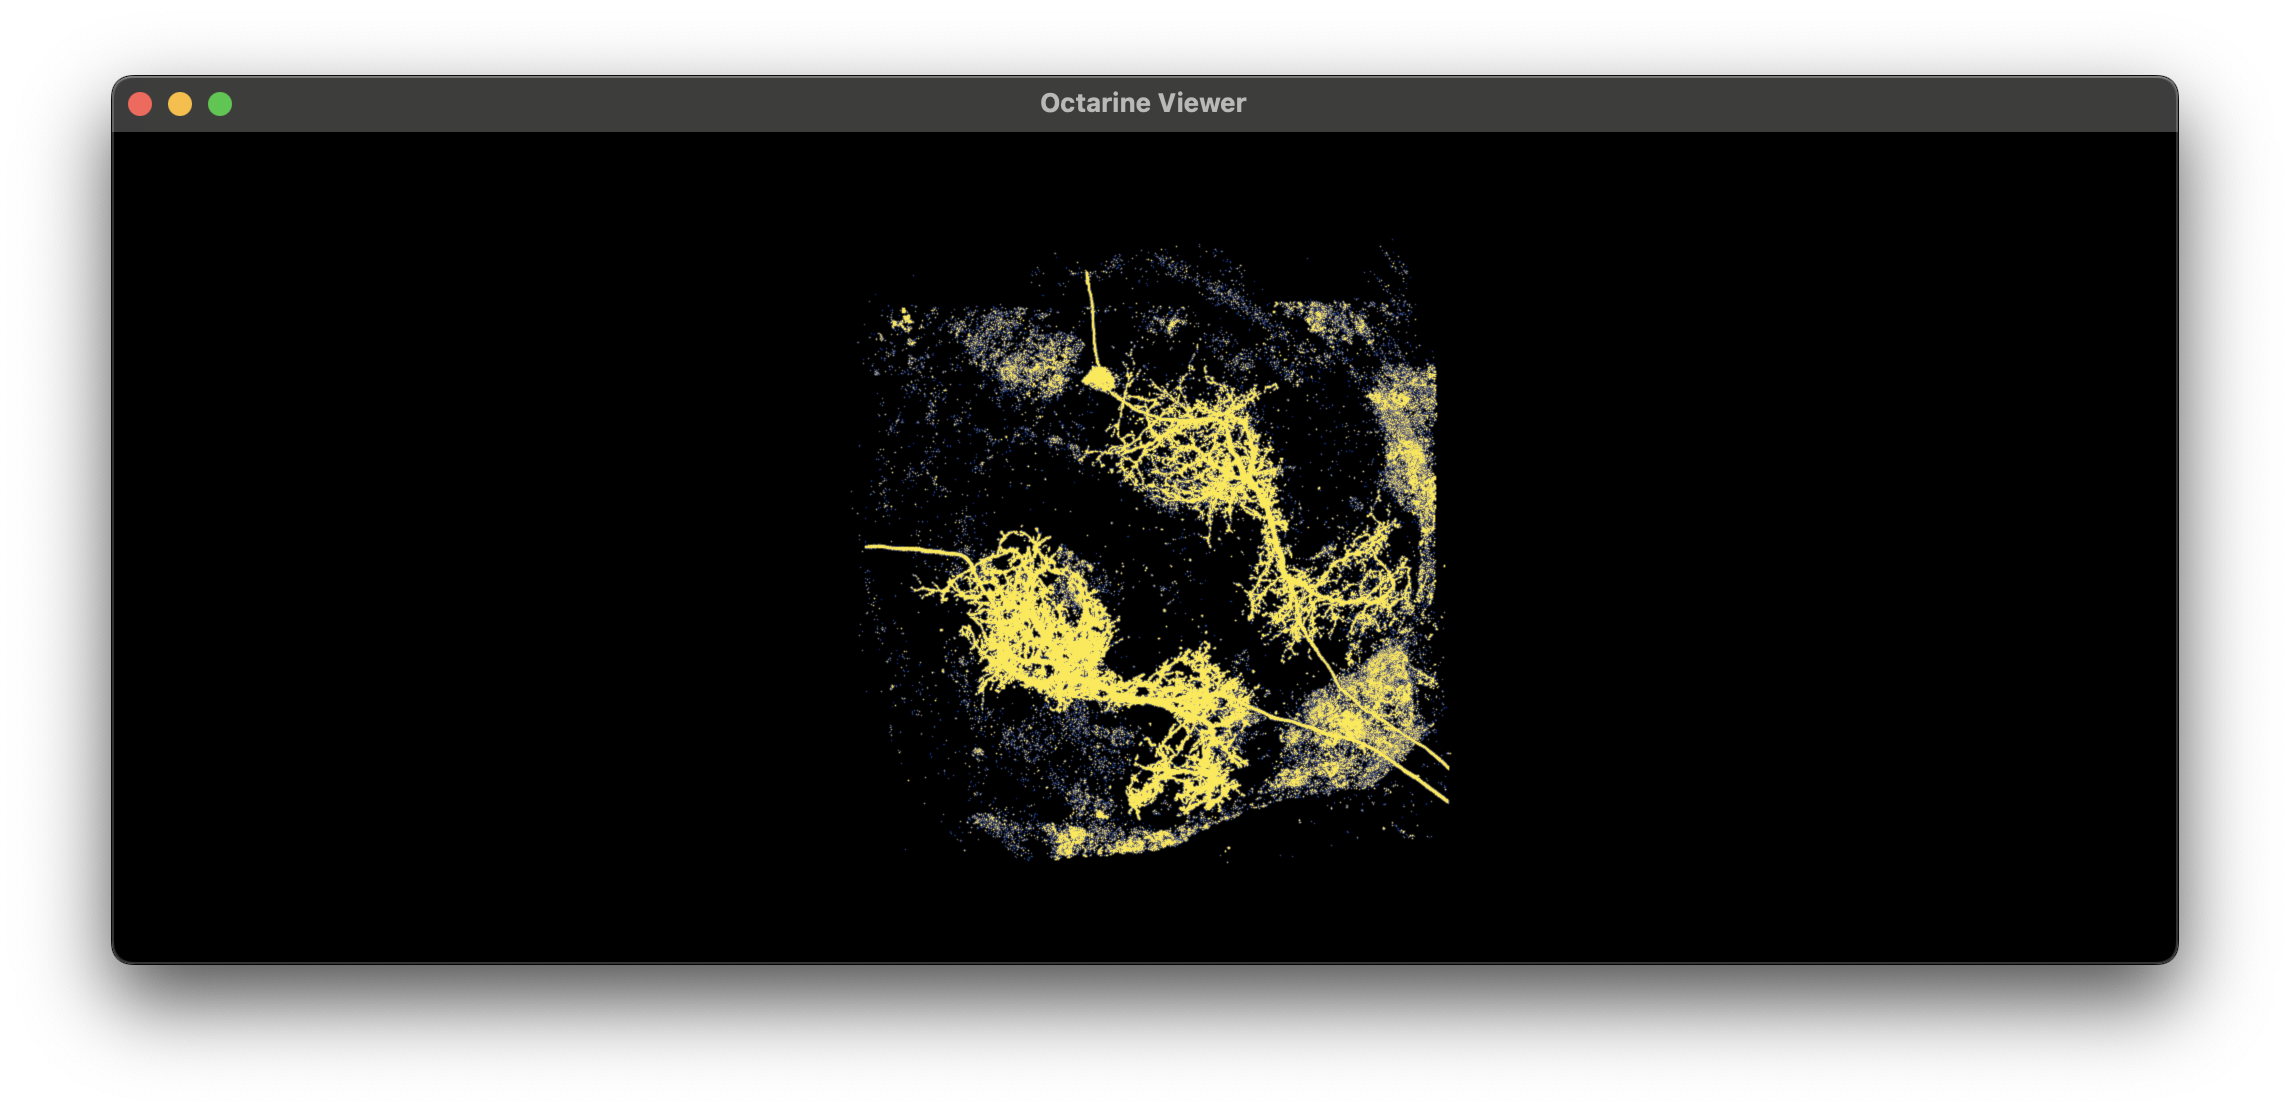
# You can inspect the mask to see if the thresholding worked as expected:
# ```python
# import matplotlib.pyplot as plt
# plt.imshow(mask.max(axis=2))
# ```
#
# With the `octarine` backend, you can also visualize the volume in 3D:
# ```python
# # spacing can be found in the `header` dictionary
# import octarine as oc
# v = oc.Viewer()
# v.add_volume(mask, spacing=(.19, .19, .38))
# ```
#
# 
#
# !!! tip "Getting the threshold right"
# - Test candidate thresholds interactively in e.g. ImageJ/Fiji.
# - Remove as much background as possible *without* disconnecting neurites.
# - Perfection is the enemy of progress - we can denoise and reconnect during post-processing.
#
# Next, label the connected components in the image:
# %%
# Extract the labels
labels, N = cc3d.connected_components(mask, return_N=True)
# %%
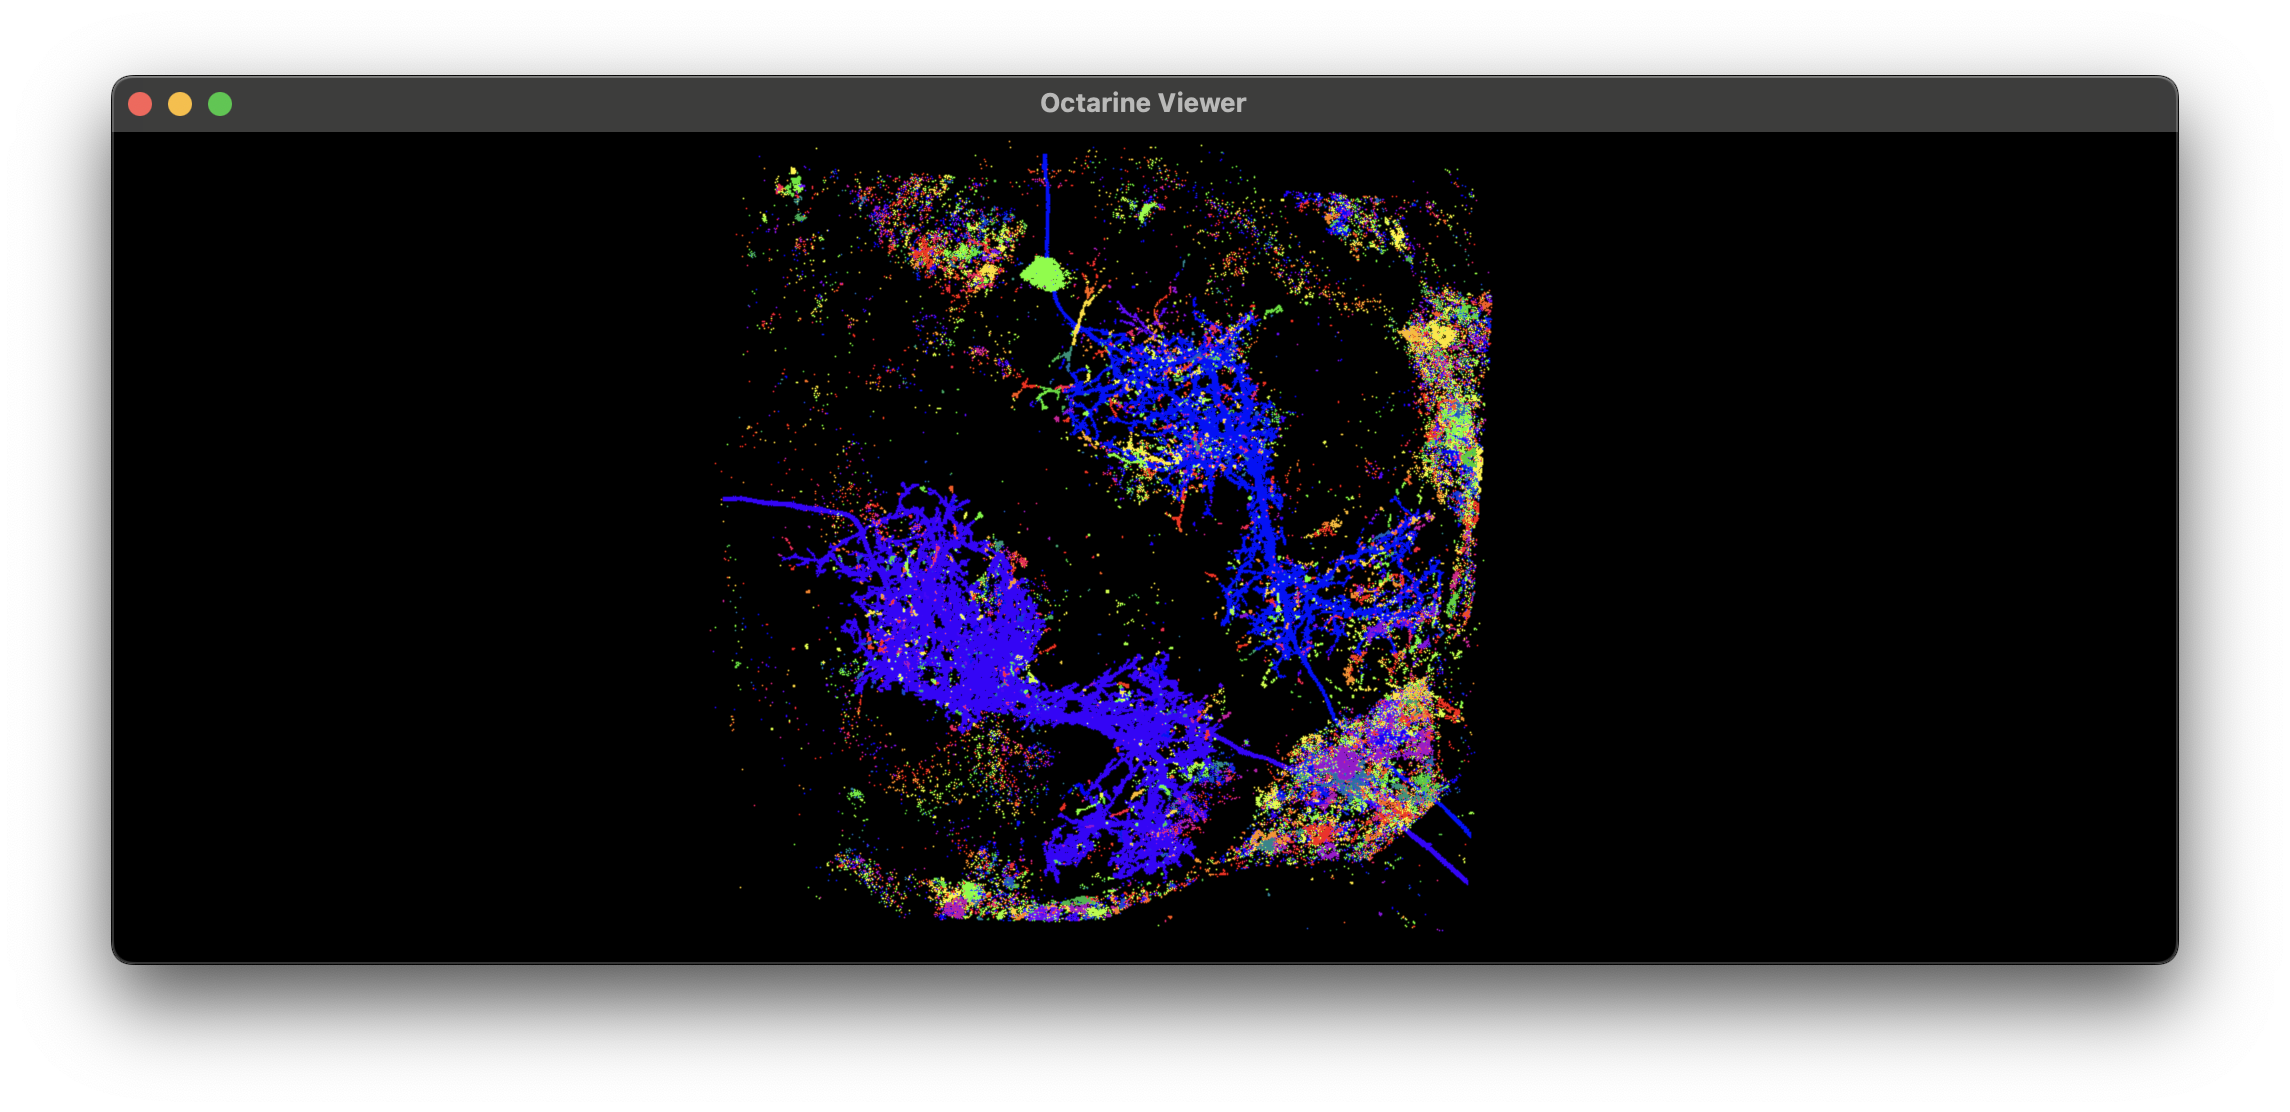
# Visualize the labels:
# ```python
# import cmap
# import octarine as oc
# v = oc.Viewer()
# v.add_volume(labels, spacing=(.19, .19, .38), color=cmap.Colormap('prism'))
# ```
#
# 
#
# !!! experiment
# `cc3d.connected_component` also works with non-thresholded image - see the `delta` parameter.
# Collect some statistics
stats = cc3d.statistics(labels)
print("Total no. of labeled components:", N)
print("Per-label voxel counts:", np.sort(stats["voxel_counts"])[::-1])
print("Label IDs:", np.argsort(stats["voxel_counts"])[::-1])
# %%
# ```
# Total no. of labeled components: 37836
# Per-label voxel counts: [491996140 527374 207632 ... 1 1 1]
# Label IDs: [ 0 6423 6091 ... 22350 22351 18918]
# ```
#
# Note how label `0` has suspiciously many voxels? That's because this is the background label.
# We need to make sure to exclude it from the skeletonization process:
to_skeletonize = np.arange(1, N)
# %%
# Now run the actual skeletonization.
#
# !!! note "Skeletonization parameters"
# A handful of parameters are worth tweaking for your data - the key ones are called out in the
# annotations below. See the [`kimimaro` repository](https://github.com/seung-lab/kimimaro) for the
# full list and a detailed explanation.
#
# ```python
# skels = kimimaro.skeletonize(
# labels,
# teasar_params={
# "scale": 1.5, # (1)!
# "const": 1, # physical units (1 micron in our case)
# "pdrf_scale": 100000,
# "pdrf_exponent": 4,
# "soma_acceptance_threshold": 3.5, # physical units
# "soma_detection_threshold": 1, # physical units
# "soma_invalidation_const": 0.5, # physical units
# "soma_invalidation_scale": 2,
# "max_paths": None, # (2)!
# },
# object_ids=list(to_skeletonize), # (3)!
# dust_threshold=500, # (4)!
# anisotropy=(0.19, .19, 0.38), # (5)!
# progress=True, # show progress bar
# parallel=6, # (6)!
# parallel_chunk_size=1, # skeletons processed before updating the progress bar
# )
# ```
#
# 1. Together with `const`, controls skeleton detail: lower values = more detail but more noise.
# 2. Cap on paths processed per skeleton. Set it low to finish early, e.g. for a quick test (`None` = no cap).
# 3. Only process these labels - remember we dropped the background label `0`.
# 4. Skip connected components with fewer than this many voxels.
# 5. Voxel size in physical units - check the `header` dict for your image's spacing.
# 6. Parallelism: `<= 0` uses all CPUs, `1` runs single-process, `2+` uses multiprocessing.
# %%
# `skels` is a dictionary of `{label: cloudvolume.Skeleton}`. Let's convert these to {{ navis }} neurons:
# Convert skeletons to NAVis neurons
nl = navis.NeuronList([navis.read_swc(s.to_swc(), id=i) for i, s in skels.items()])
# %%
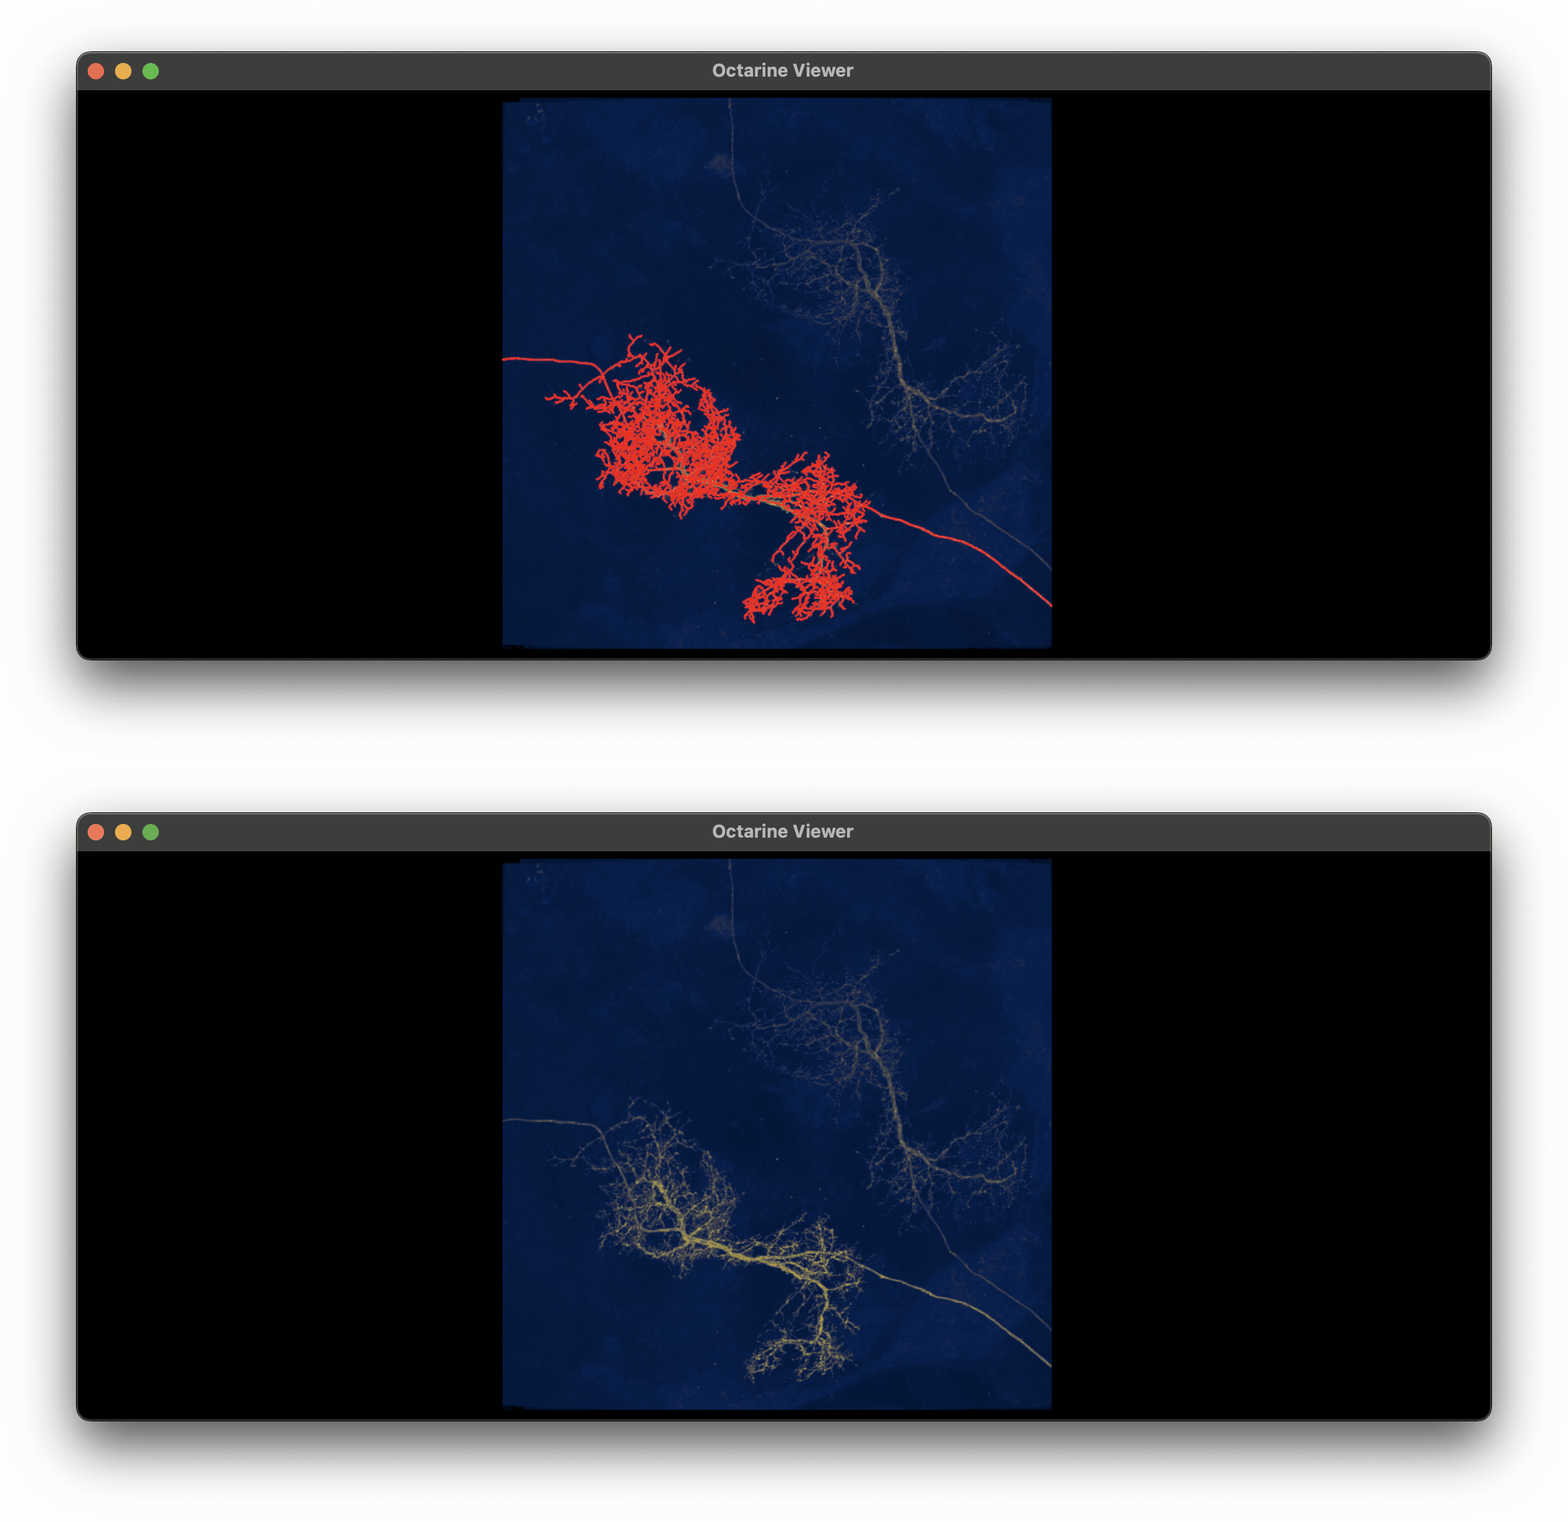
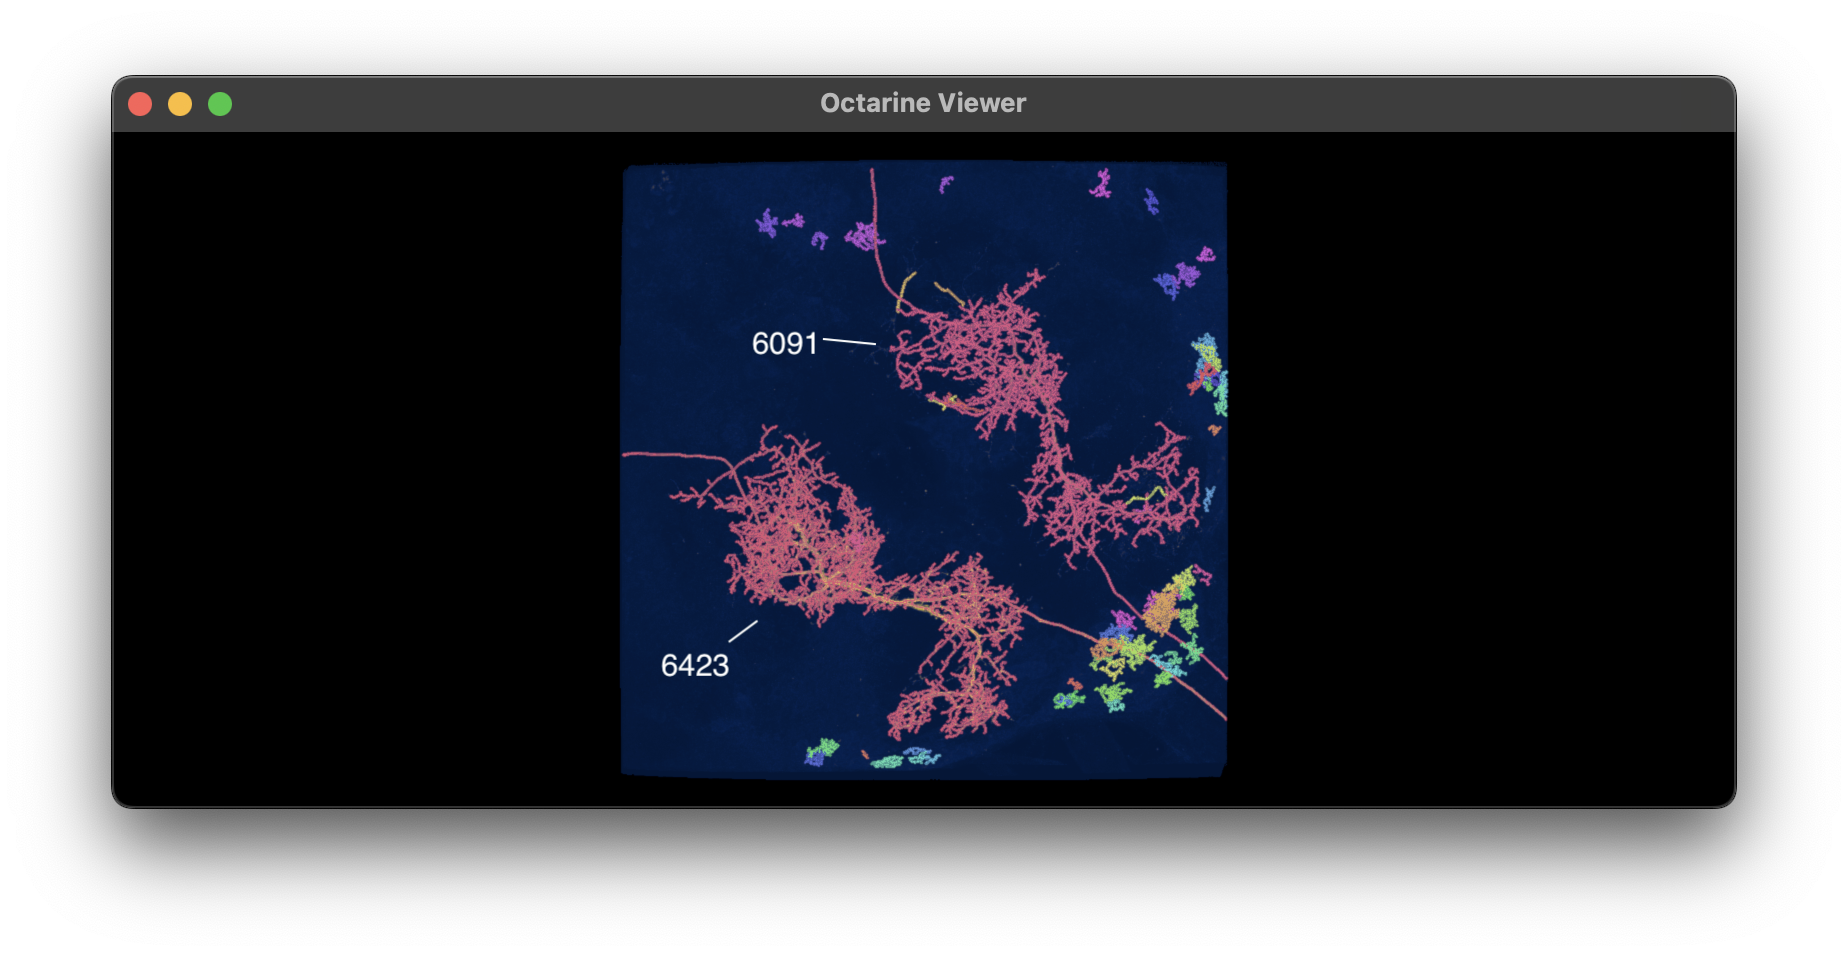
# Based on the voxel sizes in `stats`, we can make an educated guess that label `6423` is one of our neurons.
# Let's visualize it in 3D:
#
# ```python
# import octarine as oc
# v = oc.Viewer()
# v.add_neurons(nl.idx[6423], color='r', linewidth=2, radius=False))
# v.add_volume(im, spacing=(.19, .19, .38), opacity=.5)
# ```
#
# 
#
# This looks pretty good off the bat! Now obviously we will have the other large neuron (label `6091`)
# plus bunch of smaller skeletons in our NeuronList. Let's have a look at those as well:
#
# 
#
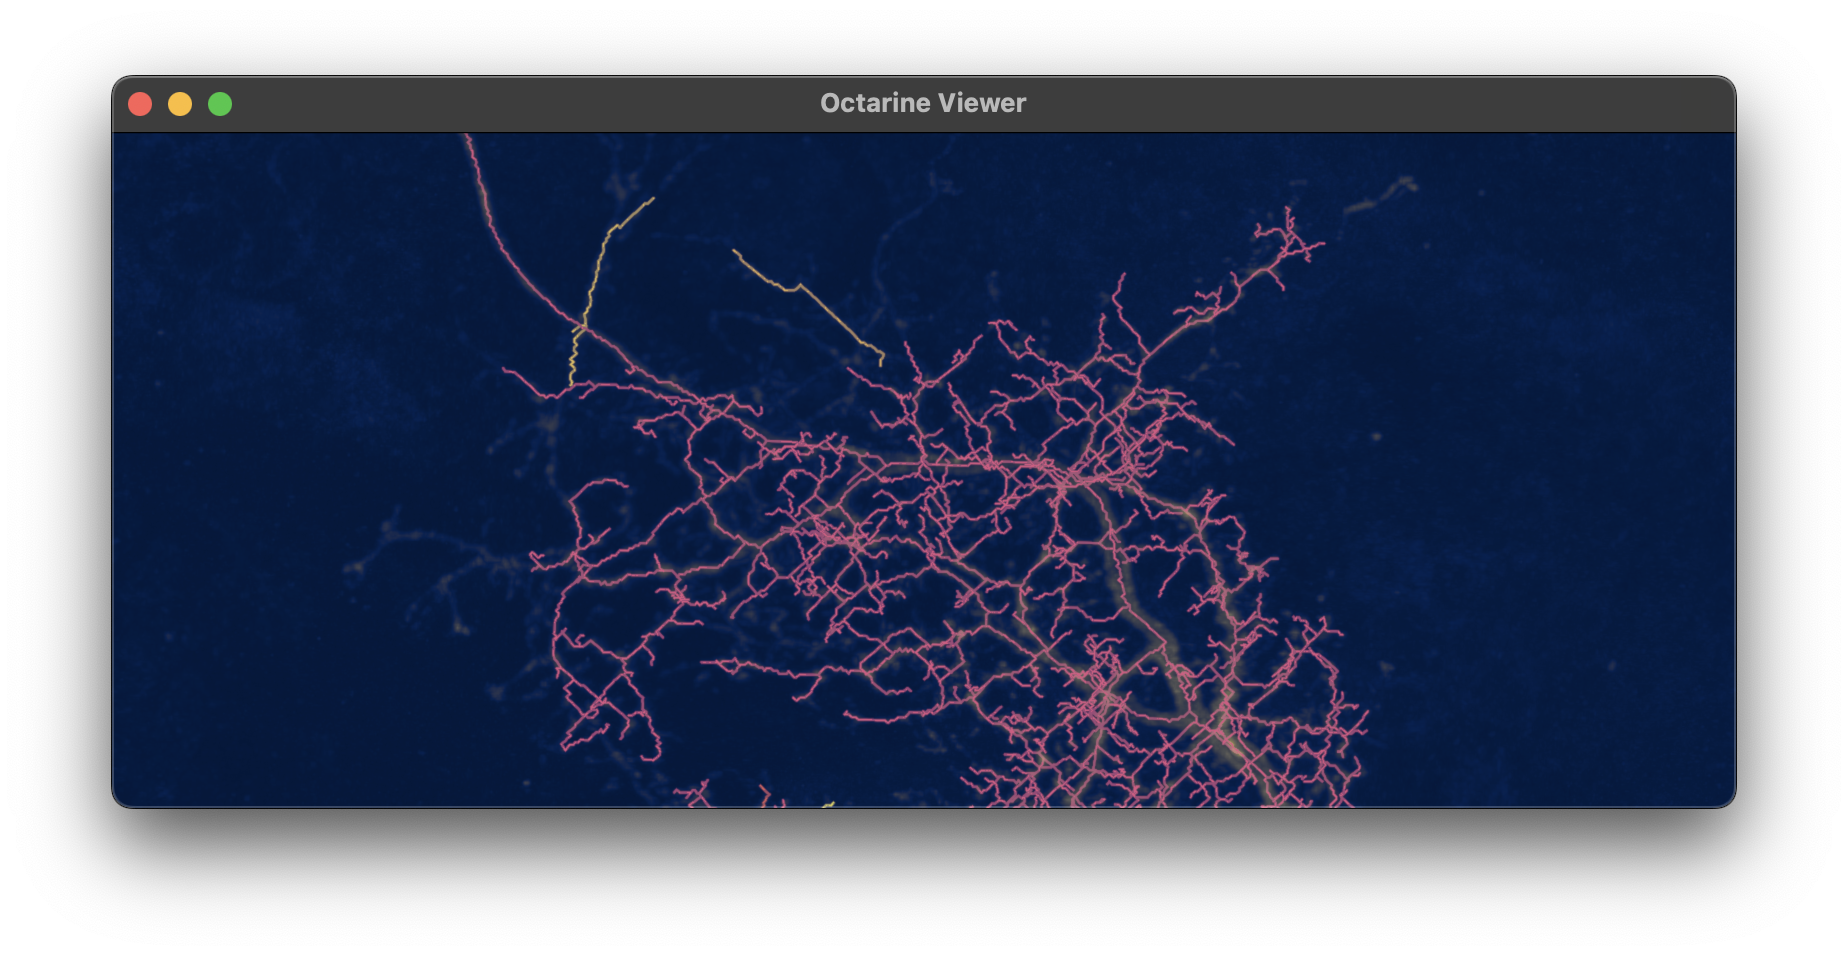
# Zooming in on `6091` you will see that it wasn't fully skeletonized: some of the branches are missing
# and others are disconnected. That's either because our threshold for the mask was too high (this neuron
# had a weaker signal than the other) and/or we dropped too many fragments during the skeletonization process
# (see the `dust_threshold` parameter).
#
# 
#
# ## Alternatives
#
# If this pipeline doesn't work for your data, consider:
#
# | Tool | What it is |
# |------|------------|
# | [Simple Neurite Tracer](https://imagej.net/plugins/snt/index) | Popular ImageJ plugin for semi-automated tracing. |
# | [Vaa3D / Mozak](https://portal.brain-map.org/explore/toolkit/morpho-reconstruction/vaa3d-mozak) | The Allen Institute's protocol for reconstructing neurons. |
# | [NeuTube](https://neutracing.com/tutorial/) | Open-source reconstruction from fluorescence microscopy images. |
#
# ## Acknowledgements
#
# The packages we used here were written by the excellent Will Silversmith from the Seung lab in Princeton.
# The image stack we processed is from the Janelia Split-Gal4 collection and was published as part of the
# [Cheong, Eichler, Stuerner, _et al._ (2024)](https://elifesciences.org/reviewed-preprints/96084v1) paper.
# %%
# mkdocs_gallery_thumbnail_path = '_static/lm_tut/z_stack.png'